
Rental Market Report September 2026
14 Sept 2026Rental growth is picking up as supply starts to fall. Our latest report looks at what this means for landlords and letting agents, and where the opportunities are in the rental market.
Read more
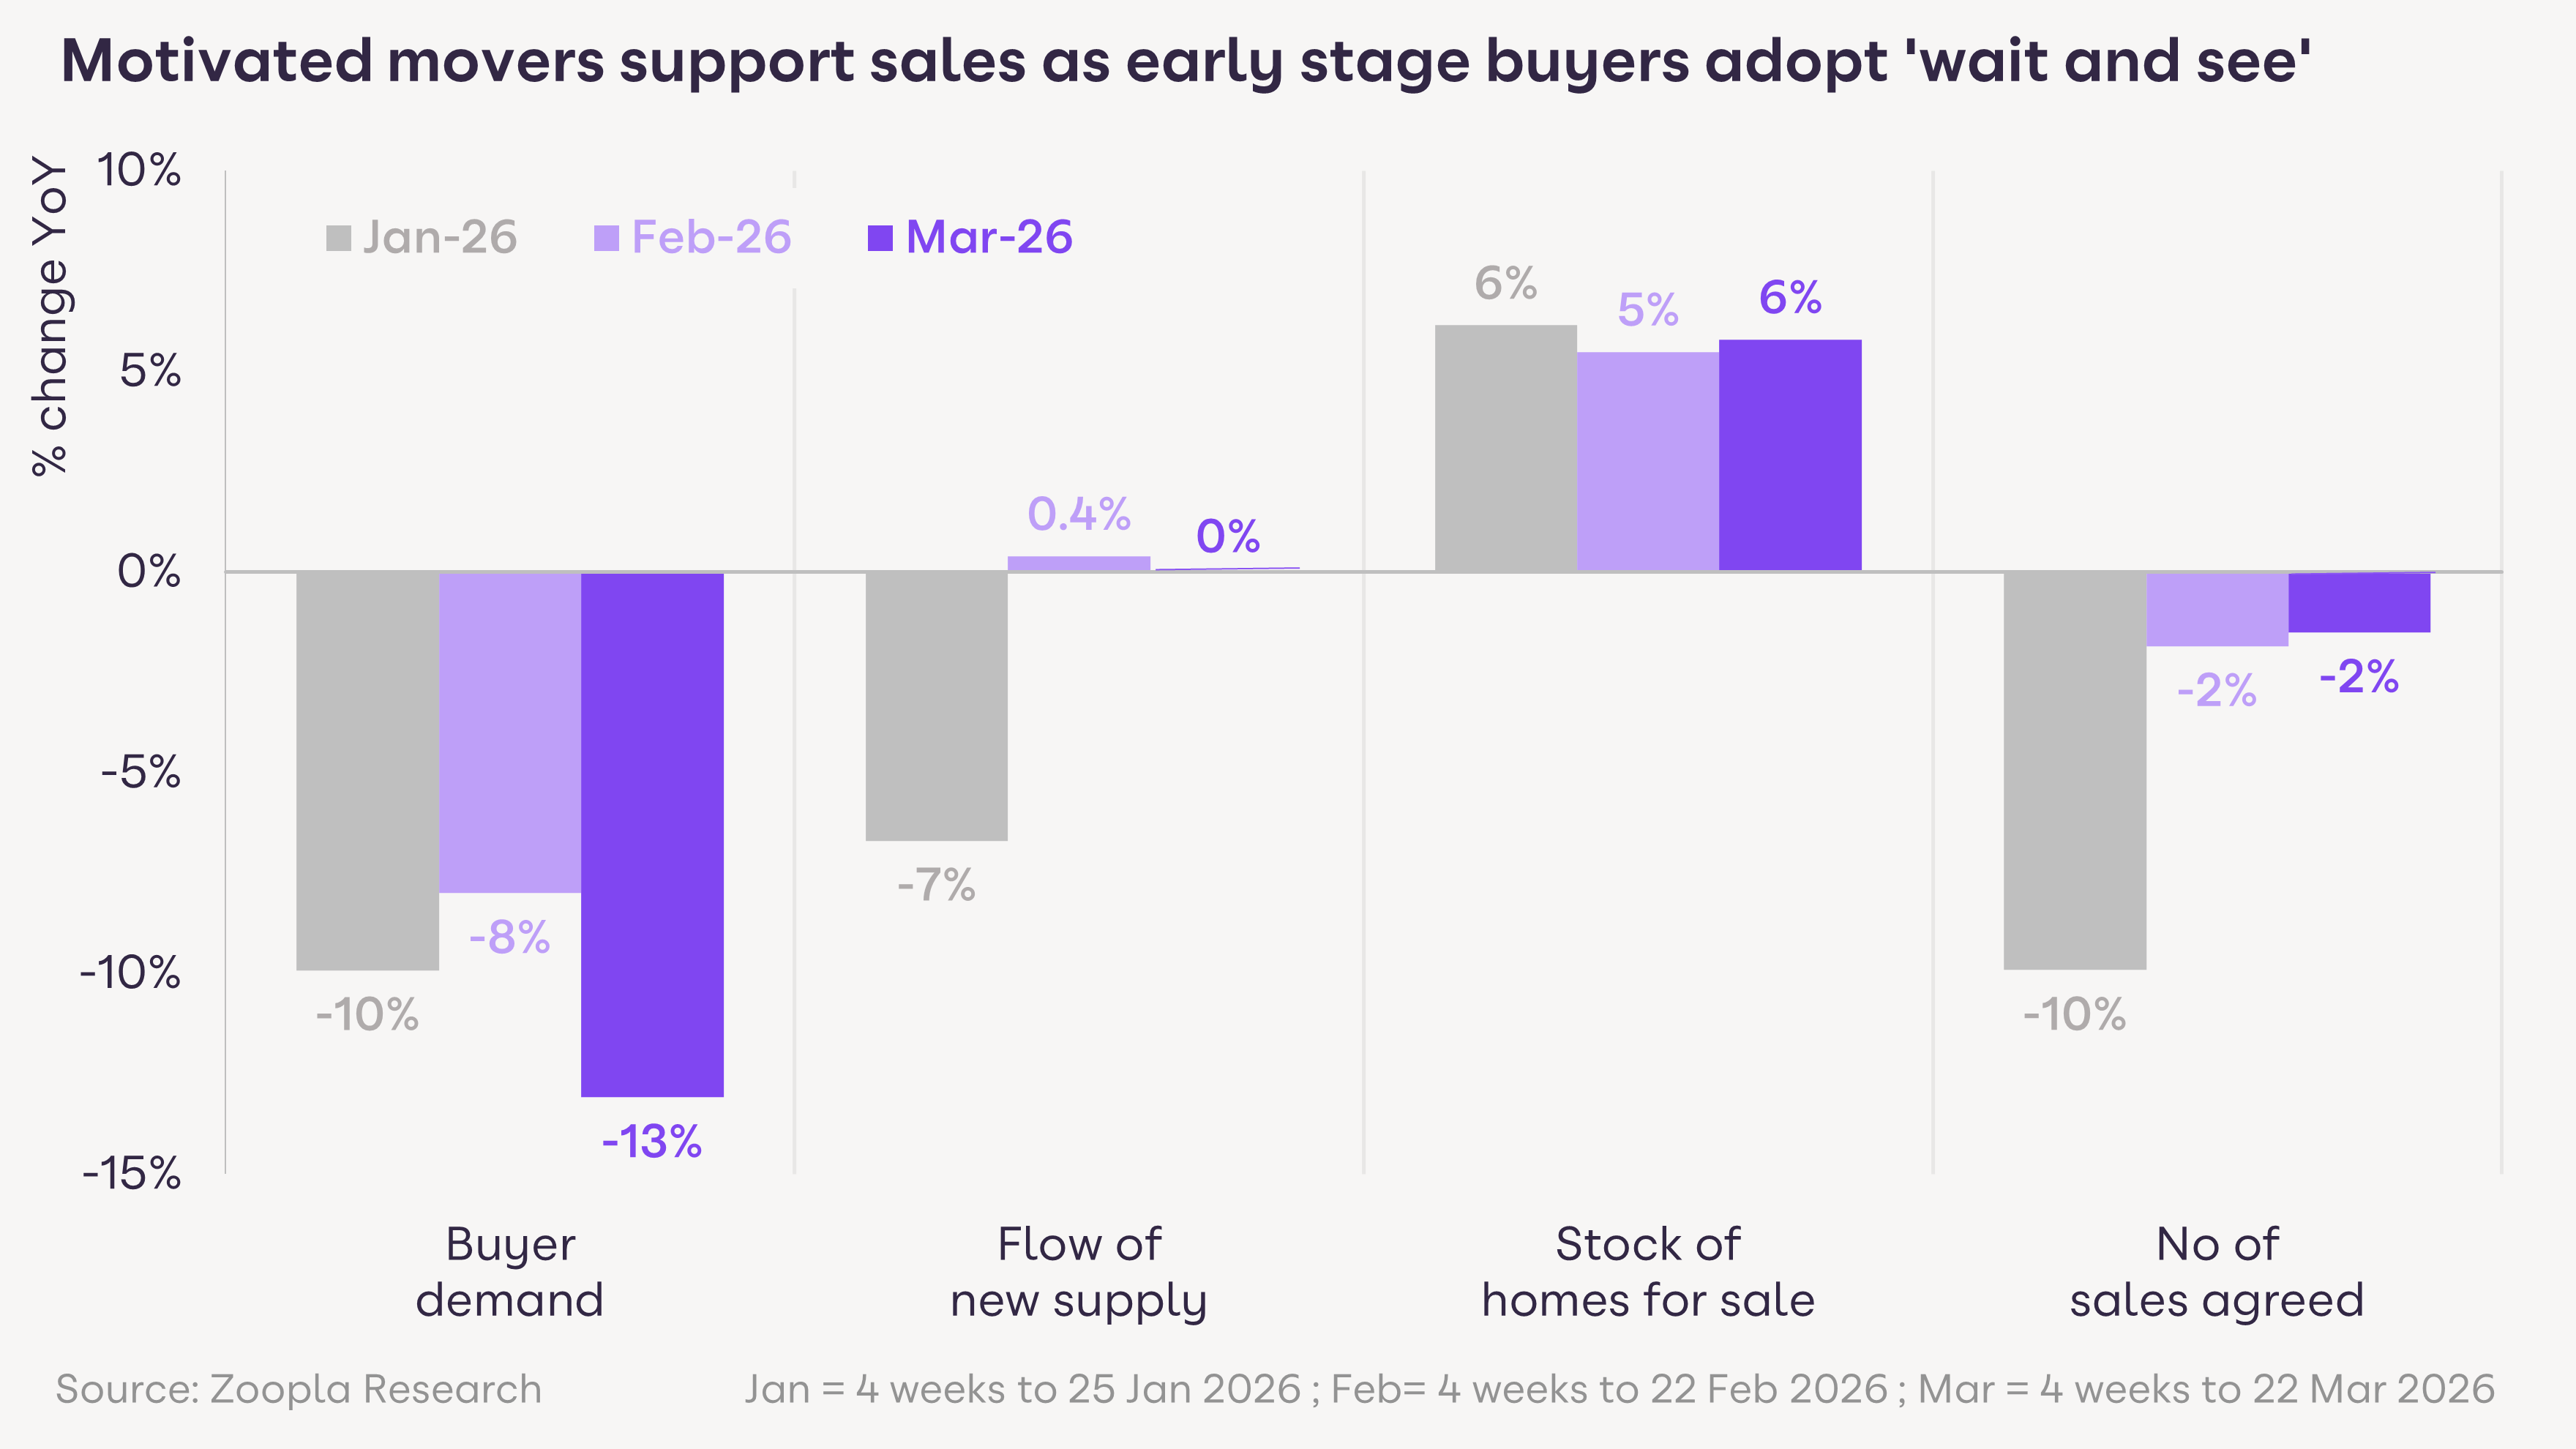
The number of sales across the market remains resilient, supported by movers who already have mortgages in place
Demand from early-stage buyers is cooling as rising mortgage rates and general economic uncertainty prompt caution
Mortgage rates have ticked up by an average 0.4 percentage points in recent weeks
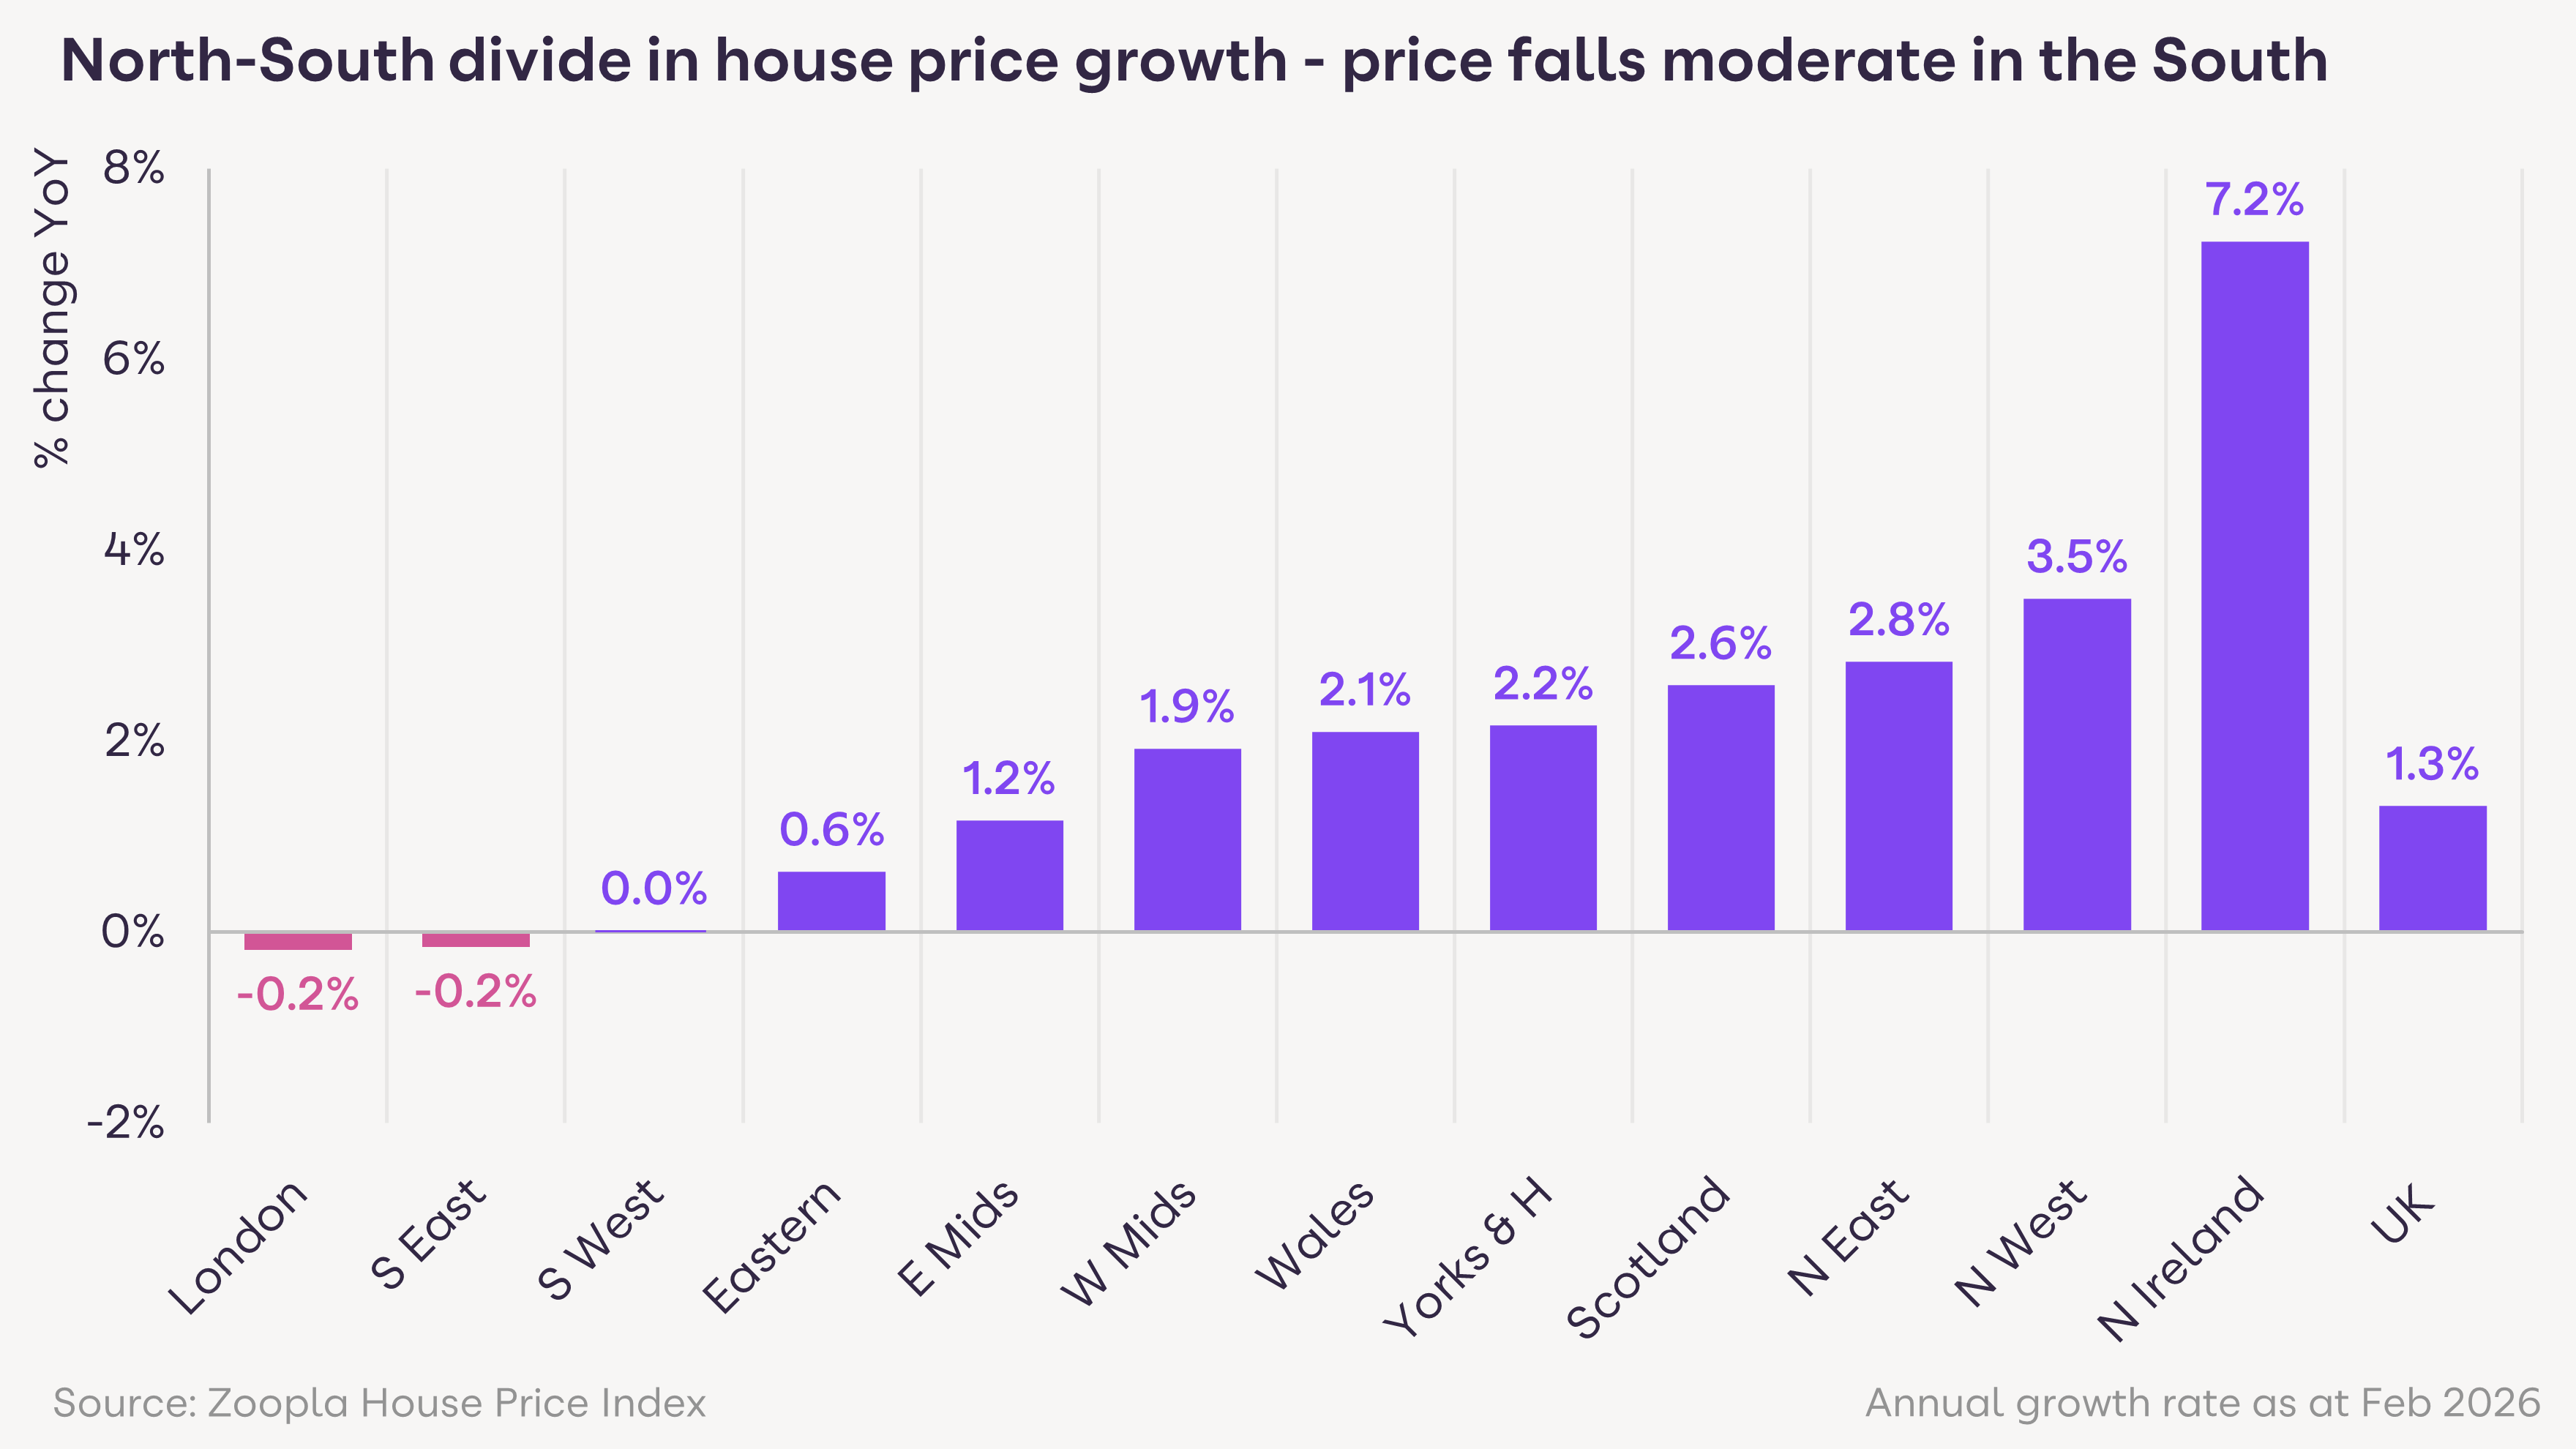
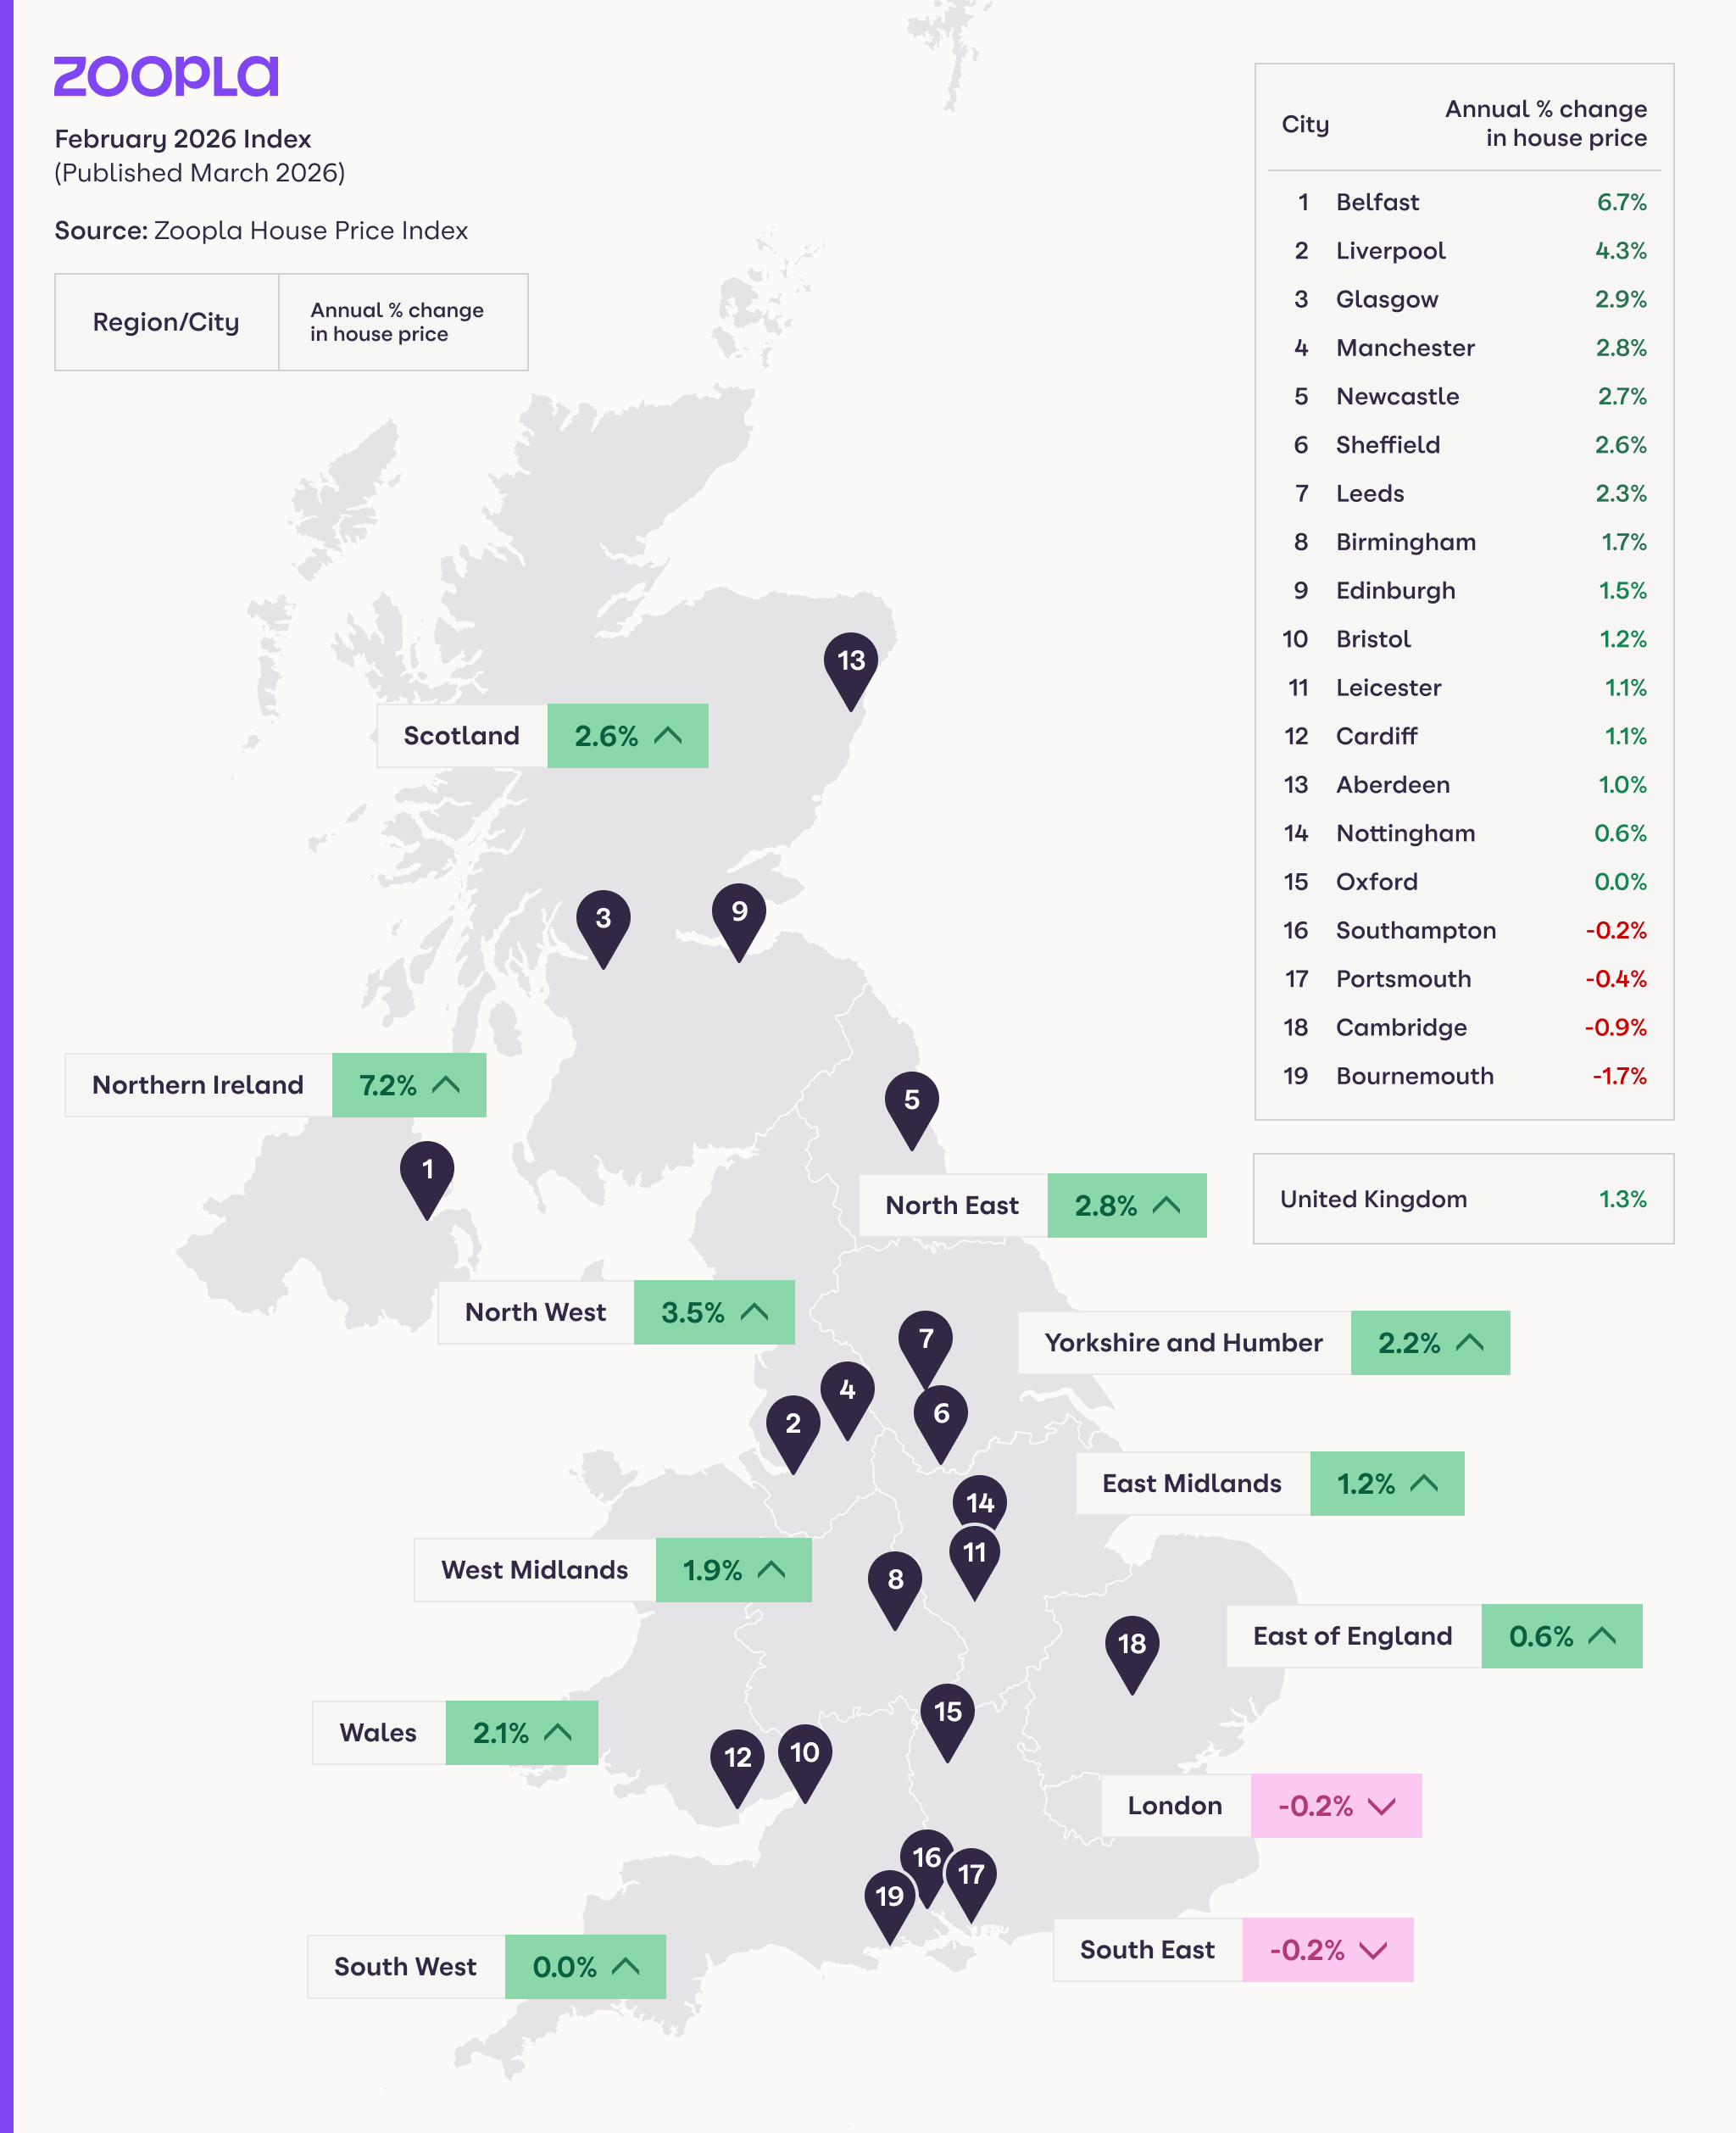
House prices are stable and holding steady at +1.3% year-on-year growth
Supply is growing with the number of homes for sale up 6% year-on-year.
The housing market is experiencing a distinct shift in dynamics this March. While top-of-funnel buyer demand has cooled in the face of recent mortgage rate increases, the actual pipeline of agreed sales is holding firm.
We’re seeing a growing divergence between general enquiries and actual transactions. The ‘wait and see’ crowd is pausing, but serious committed movers are pressing ahead. Understanding this gap is critical for both agents and housebuilders looking to maintain momentum in the coming months.
The full Zoopla House Price Index: March 2026 is available on Zoopla.co.uk.
Download the House Price Index March 2026 (PDF, 644kB)
While you may be seeing fewer casual enquiries hitting your inbox, the sales pipeline is heavily supported by committed movers.
The buyers currently active in the market are highly motivated, and they’re often sitting on significant equity, utilising cash (around 25% of current sales) or moving forward with pre-agreed mortgages.
It’s now key to:
Prioritise realistic pricing: With supply up 6% and buyers becoming more price-sensitive, overpriced stock will simply sit. Use local data to have honest conversations with sellers.
Qualify heavily: The weakening in buyer demand in March means you need to quickly identify the serious movers and focus your energy on getting them over the line.
Monitor demand closely: Buyer intent is becoming more localised and volatile. Stay close to regional and hyperlocal data to understand local affordability and where your buyers are coming from.

The headline house price growth rate is stable but performance varies by property type. Semi-detached and terraced homes are currently seeing the highest price growth, while flats are experiencing slight price corrections.
Property type | Avg price Dec 2025 | Avg price Jan 2026 | Avg price Feb 2026 | Annual price change (£) | Annual price change (%) |
All property | £269,800 | £270,300 | £270,500 | £3,540 | 1.30% |
Flats and maisonettes | £191,400 | £191,900 | £191,800 | -£2,120 | -1.10% |
Terraced houses | £239,100 | £239,400 | £240,200 | £4,670 | 2.00% |
Semi-detached houses | £277,800 | £277,900 | £279,200 | £6,640 | 2.40% |
Detached houses | £453,000 | £453,700 | £455,000 | £5,620 | 1.30% |
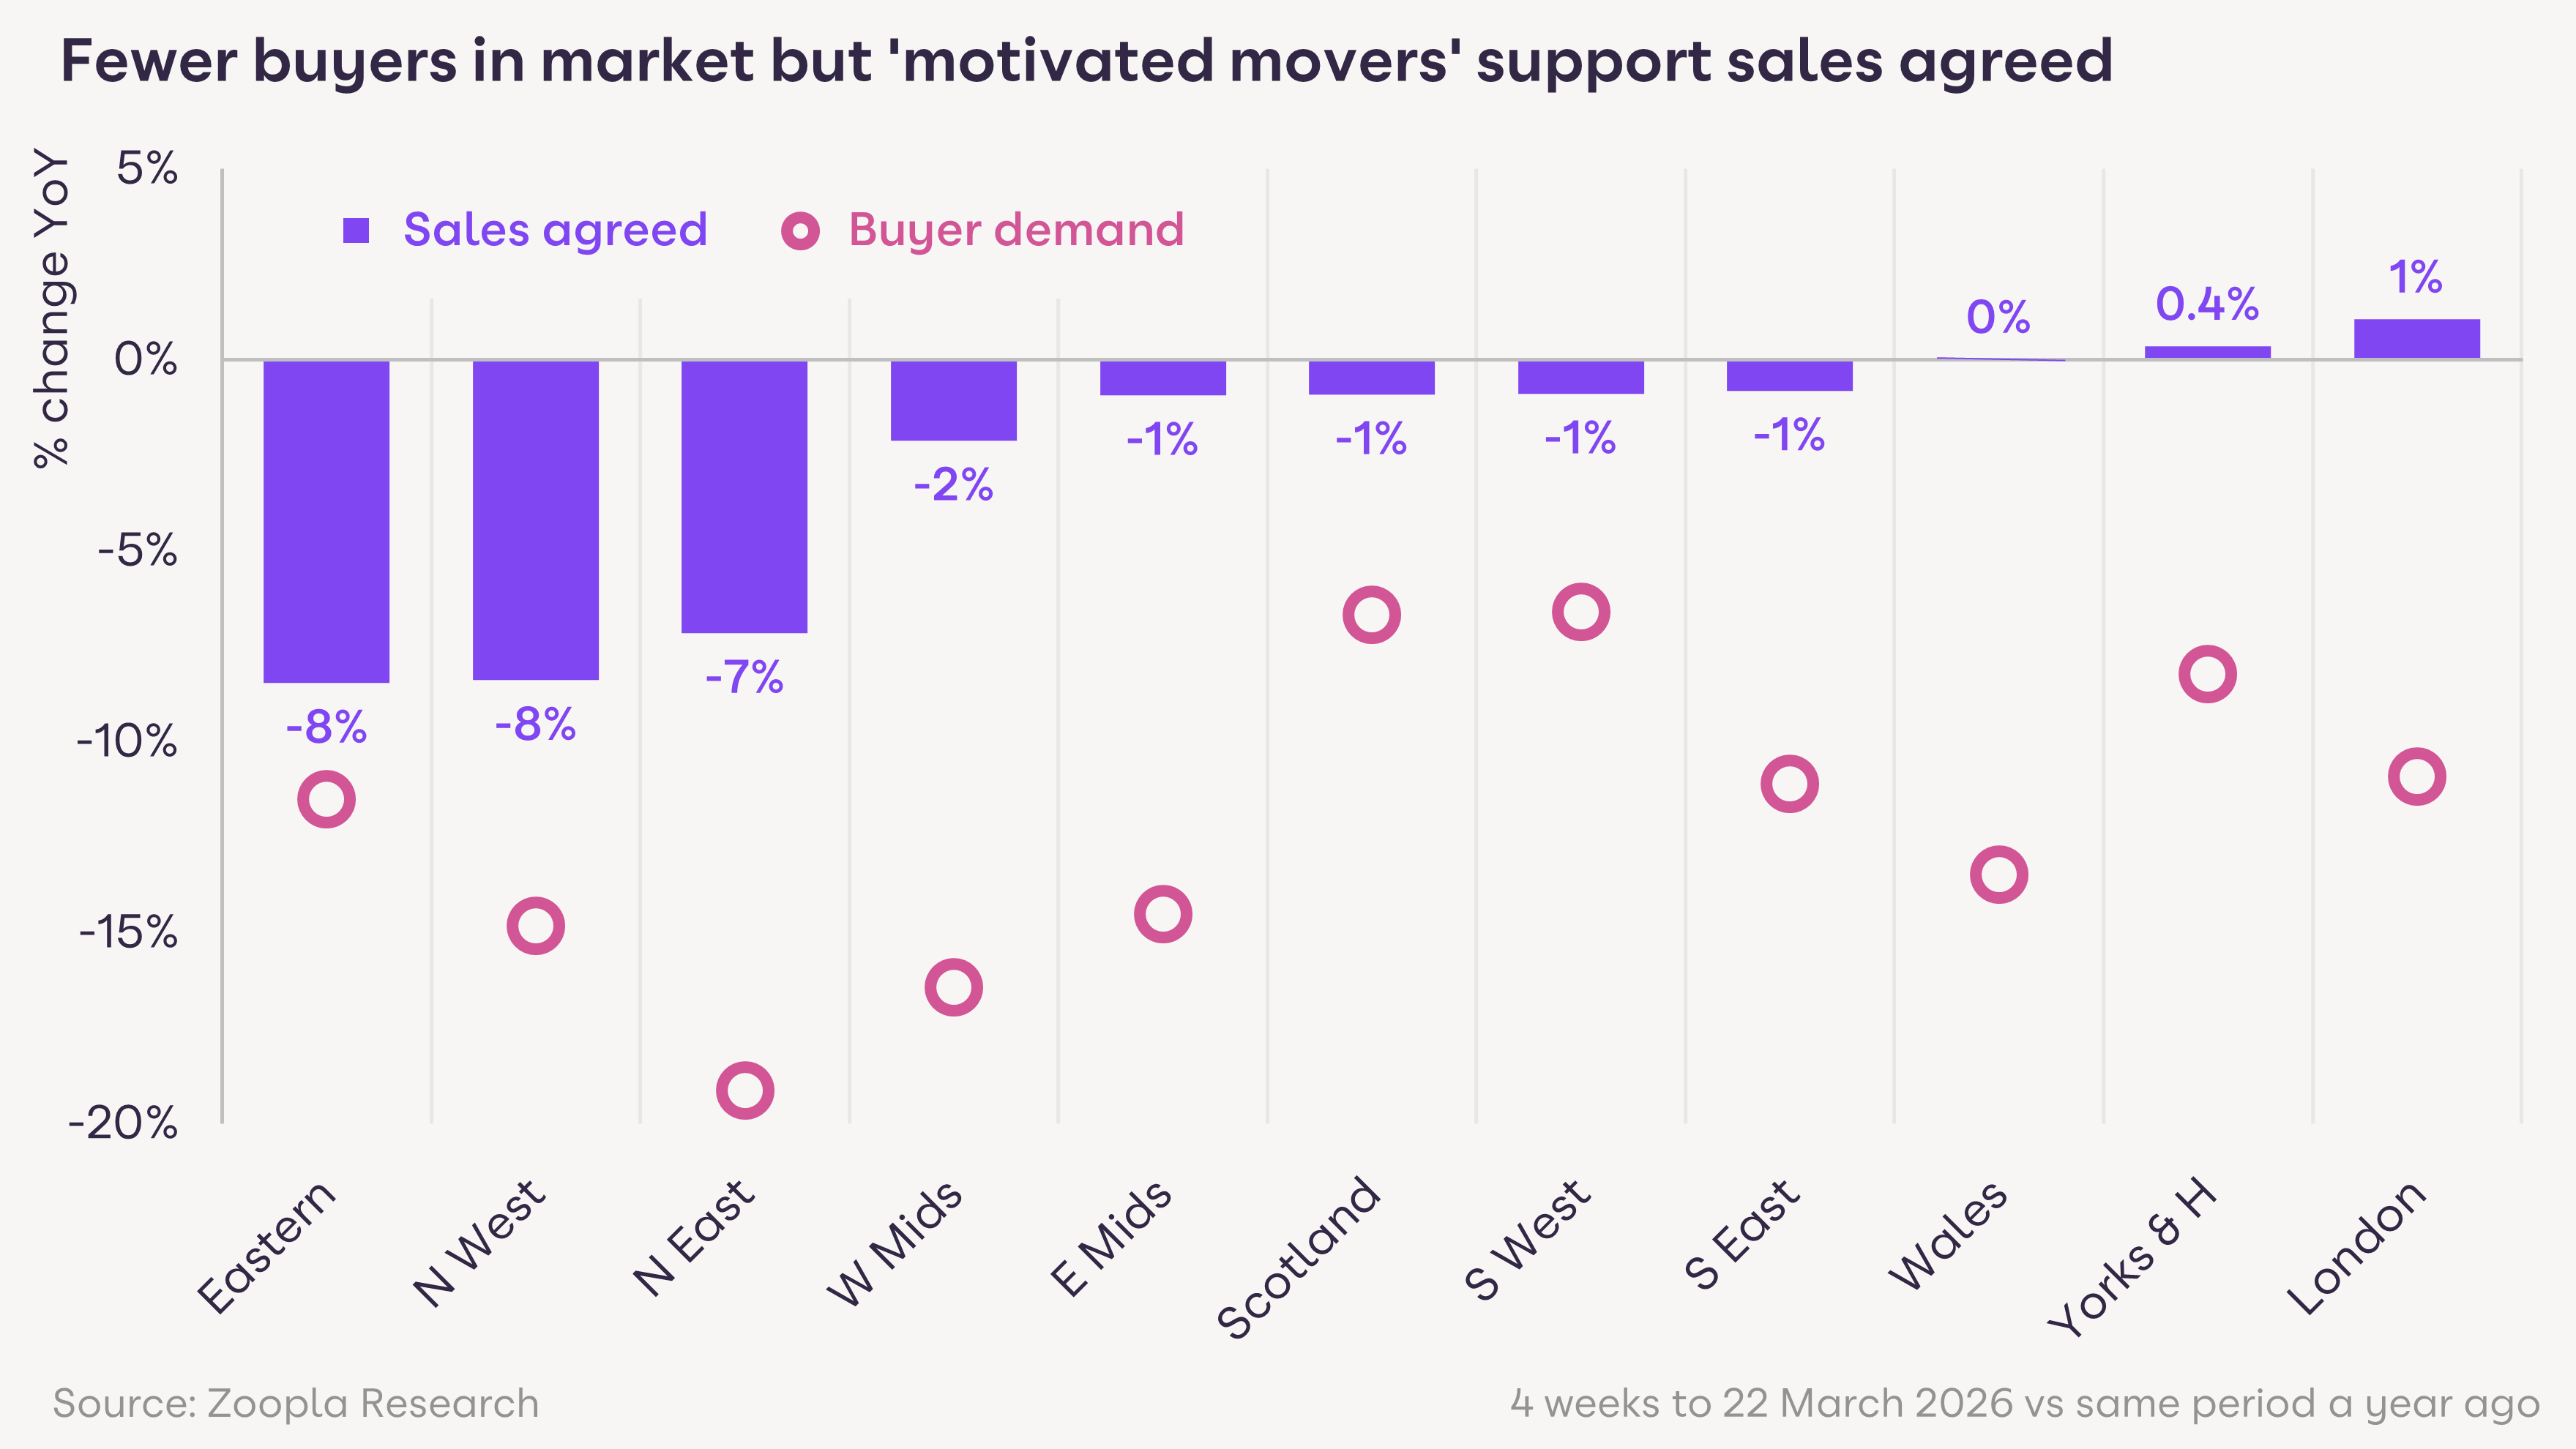
The divergence between sales and buyer enquiries is evident across all regions and countries of the UK. Buyer enquiries are down across all areas on last year, with the largest decline in active buyers recorded in the North East and West Midlands, coming off a high base.
Meanwhile, sales agreed are holding up more consistently, with declines generally more modest and some regions - such as Yorkshire and the Humber and London - seeing broadly stable or slightly higher levels of activity compared to last year.
This consistency reinforces the view that the current market is being supported by a smaller pool of committed buyers rather than broad-based demand. The number of potential buyers in the market is more volatile than sales highlighting the importance of a focus on the strength of buyer intent rather than headline levels of enquiries.
Despite the softening in top-level demand, UK house price growth remains stable at +1.3%. We do not anticipate a significant slowdown in near-term house price growth.
For prices to take a material hit, we would need to see a much sharper and sustained decline in actual sales volumes, rather than just a drop in initial enquiries.
If mortgage rates stabilise at current levels, we expect sales activity to continue holding up well compared to last year.
Speak to our team to get started and grow faster in your local market.

The Zoopla House Price Index (HPI) is published on Zoopla.co.uk and tracks the change in achieved sales price of homes. It’s not an index that tracks asking prices. It uses sold prices, mortgage valuations and data for recently agreed sales with more input data than any other index. The methodology is designed to accurately track the change in pricing for UK housing. It’s revisionary and non-seasonally adjusted.
We try to make sure that the information here is accurate at the time of publishing. But the property market moves fast and some information may now be out of date. Zoopla accepts no responsibility or liability for any decisions you make based on the information provided.
Rental growth is picking up as supply starts to fall. Our latest report looks at what this means for landlords and letting agents, and where the opportunities are in the rental market.
Read more
We are delivering significantly more valuation leads to estate agents in 2026, powered by growth in our homeowner audience to 5.6 million subscribers.
Read more
Single earners now represent almost 40% of the first-time buyer market. As mortgage rates stabilise and lending rules ease, understanding single-income affordability is key to unlocking regional demand.
Read more