
Win more instructions with Zoopla Masterclass
12 May 2026Get an edge with exclusive lessons from industry expert Ian Preston.
Read more
Higher mortgage rates are making buyers more selective
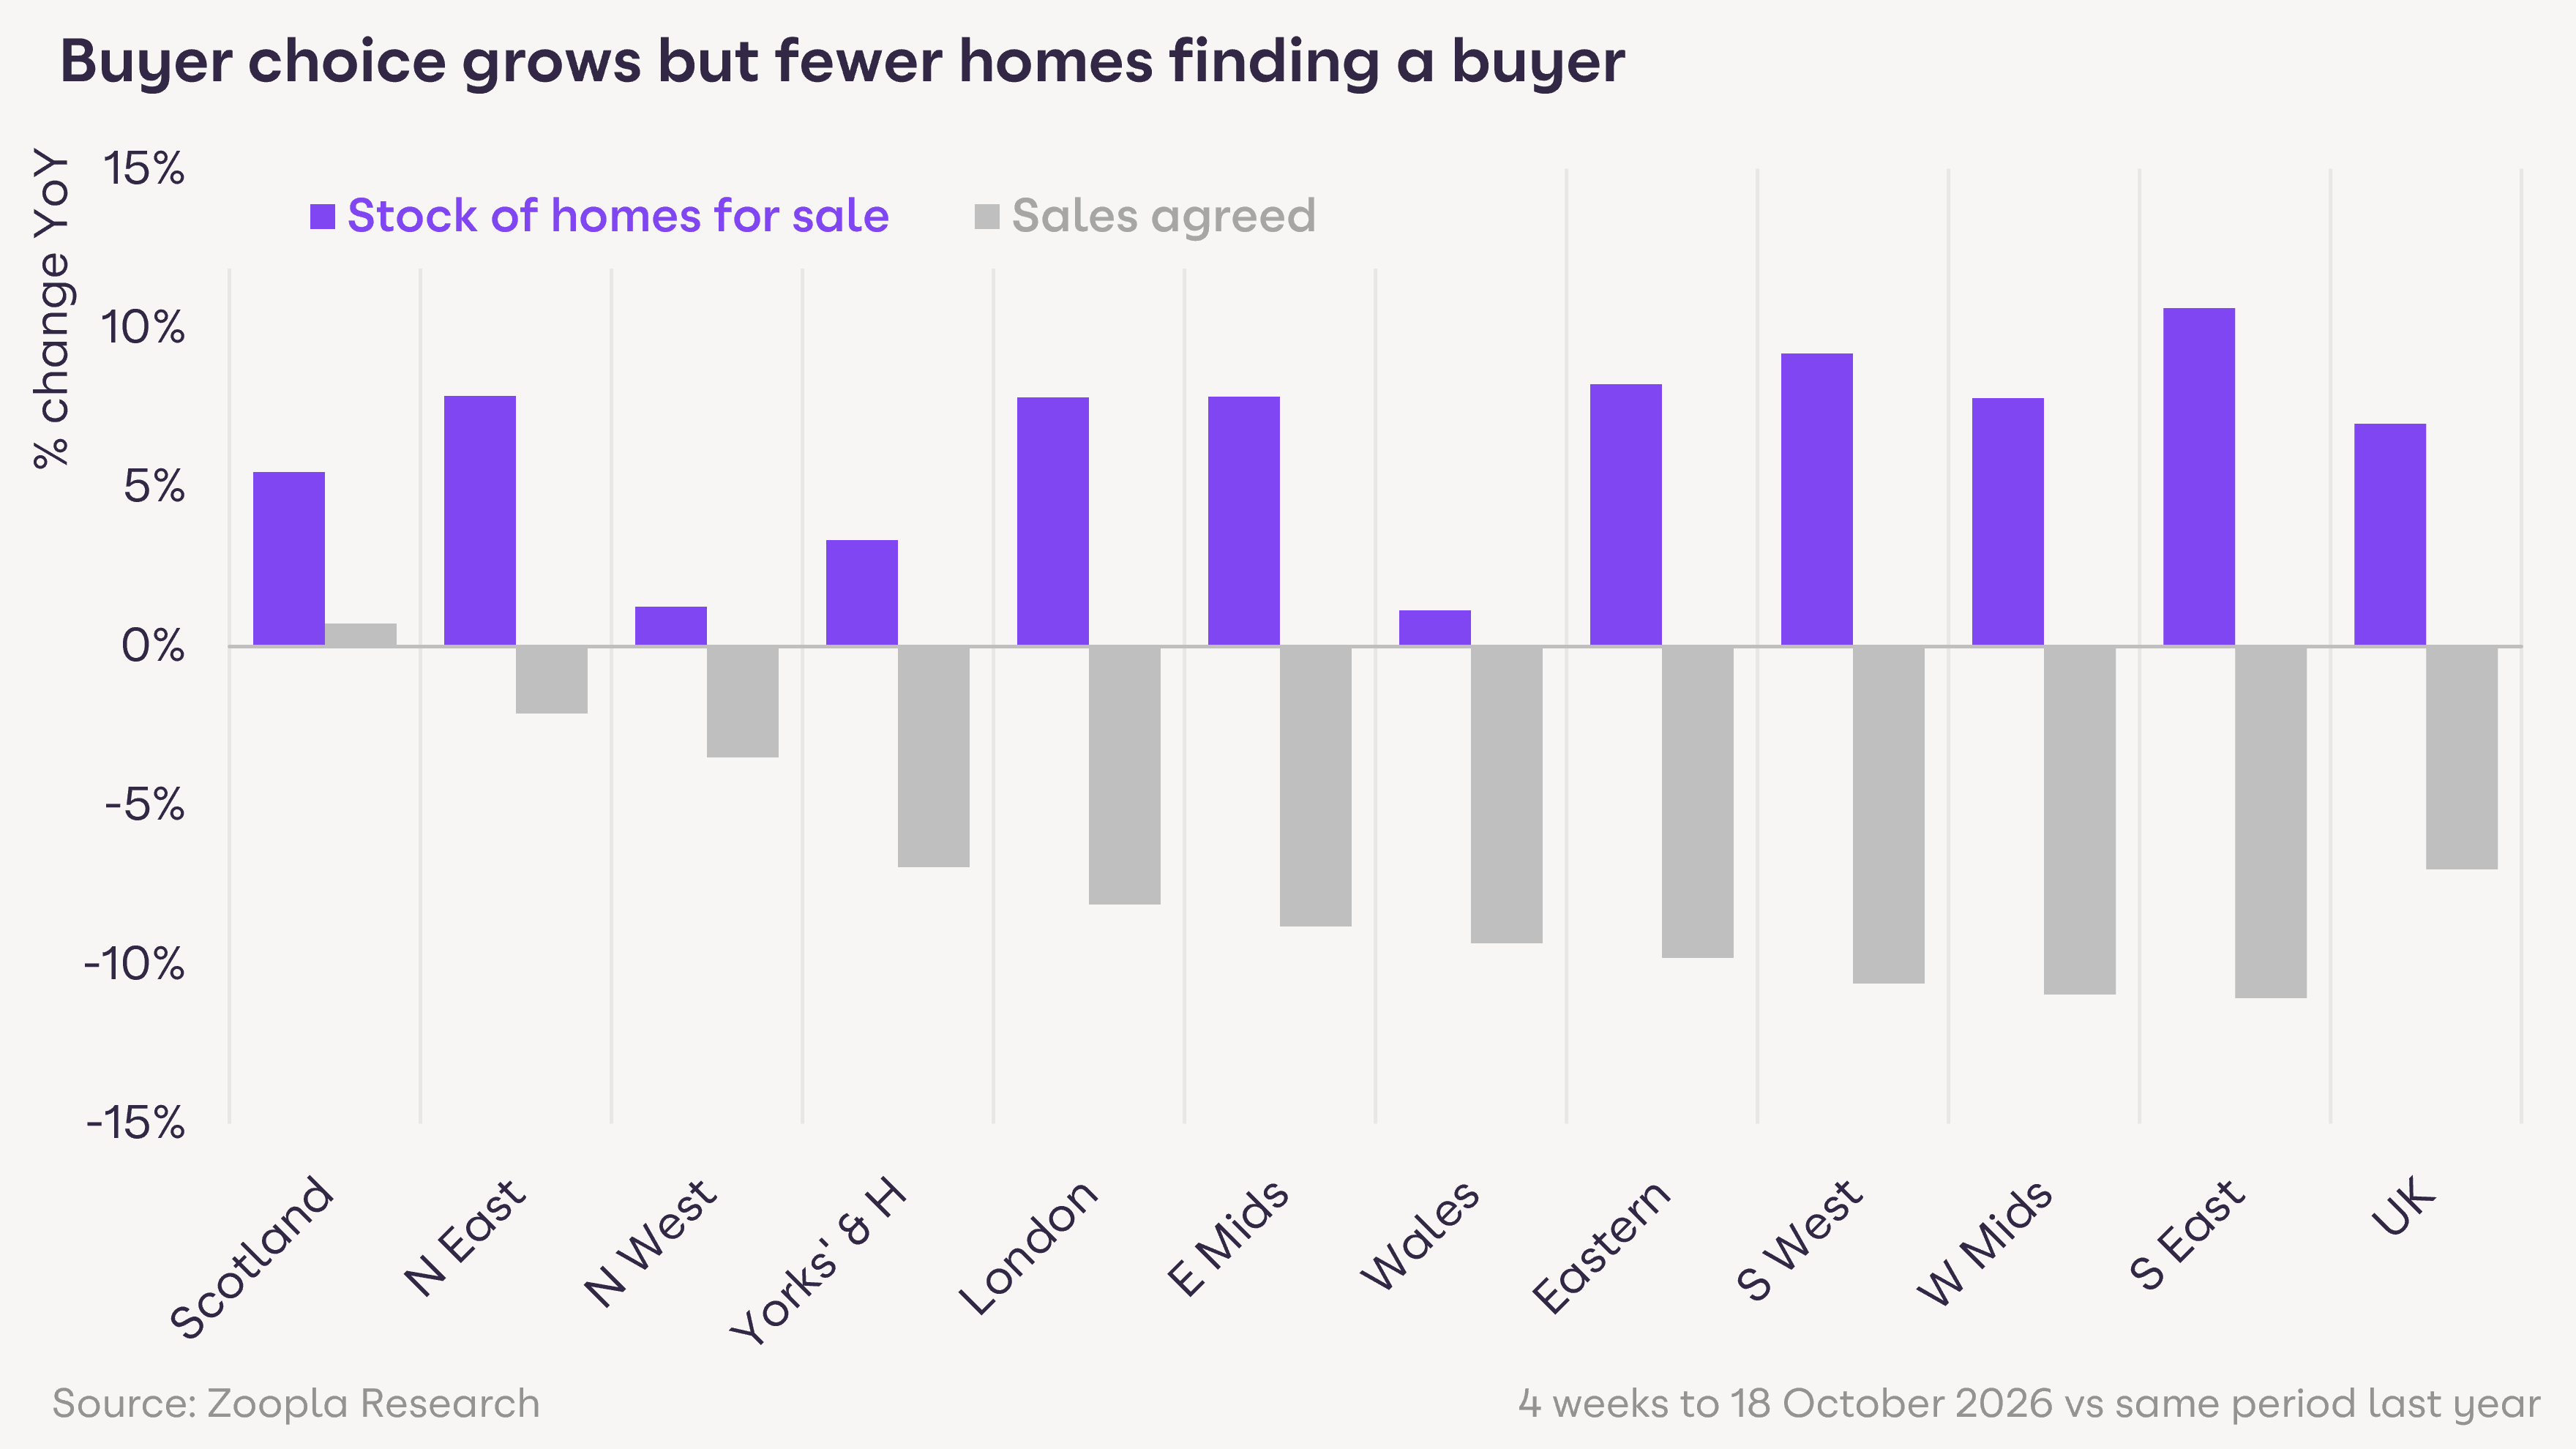
Our data shows that sales agreed are 7% lower than a year ago and stock is 7% higher, with homes battling more competition for buyers
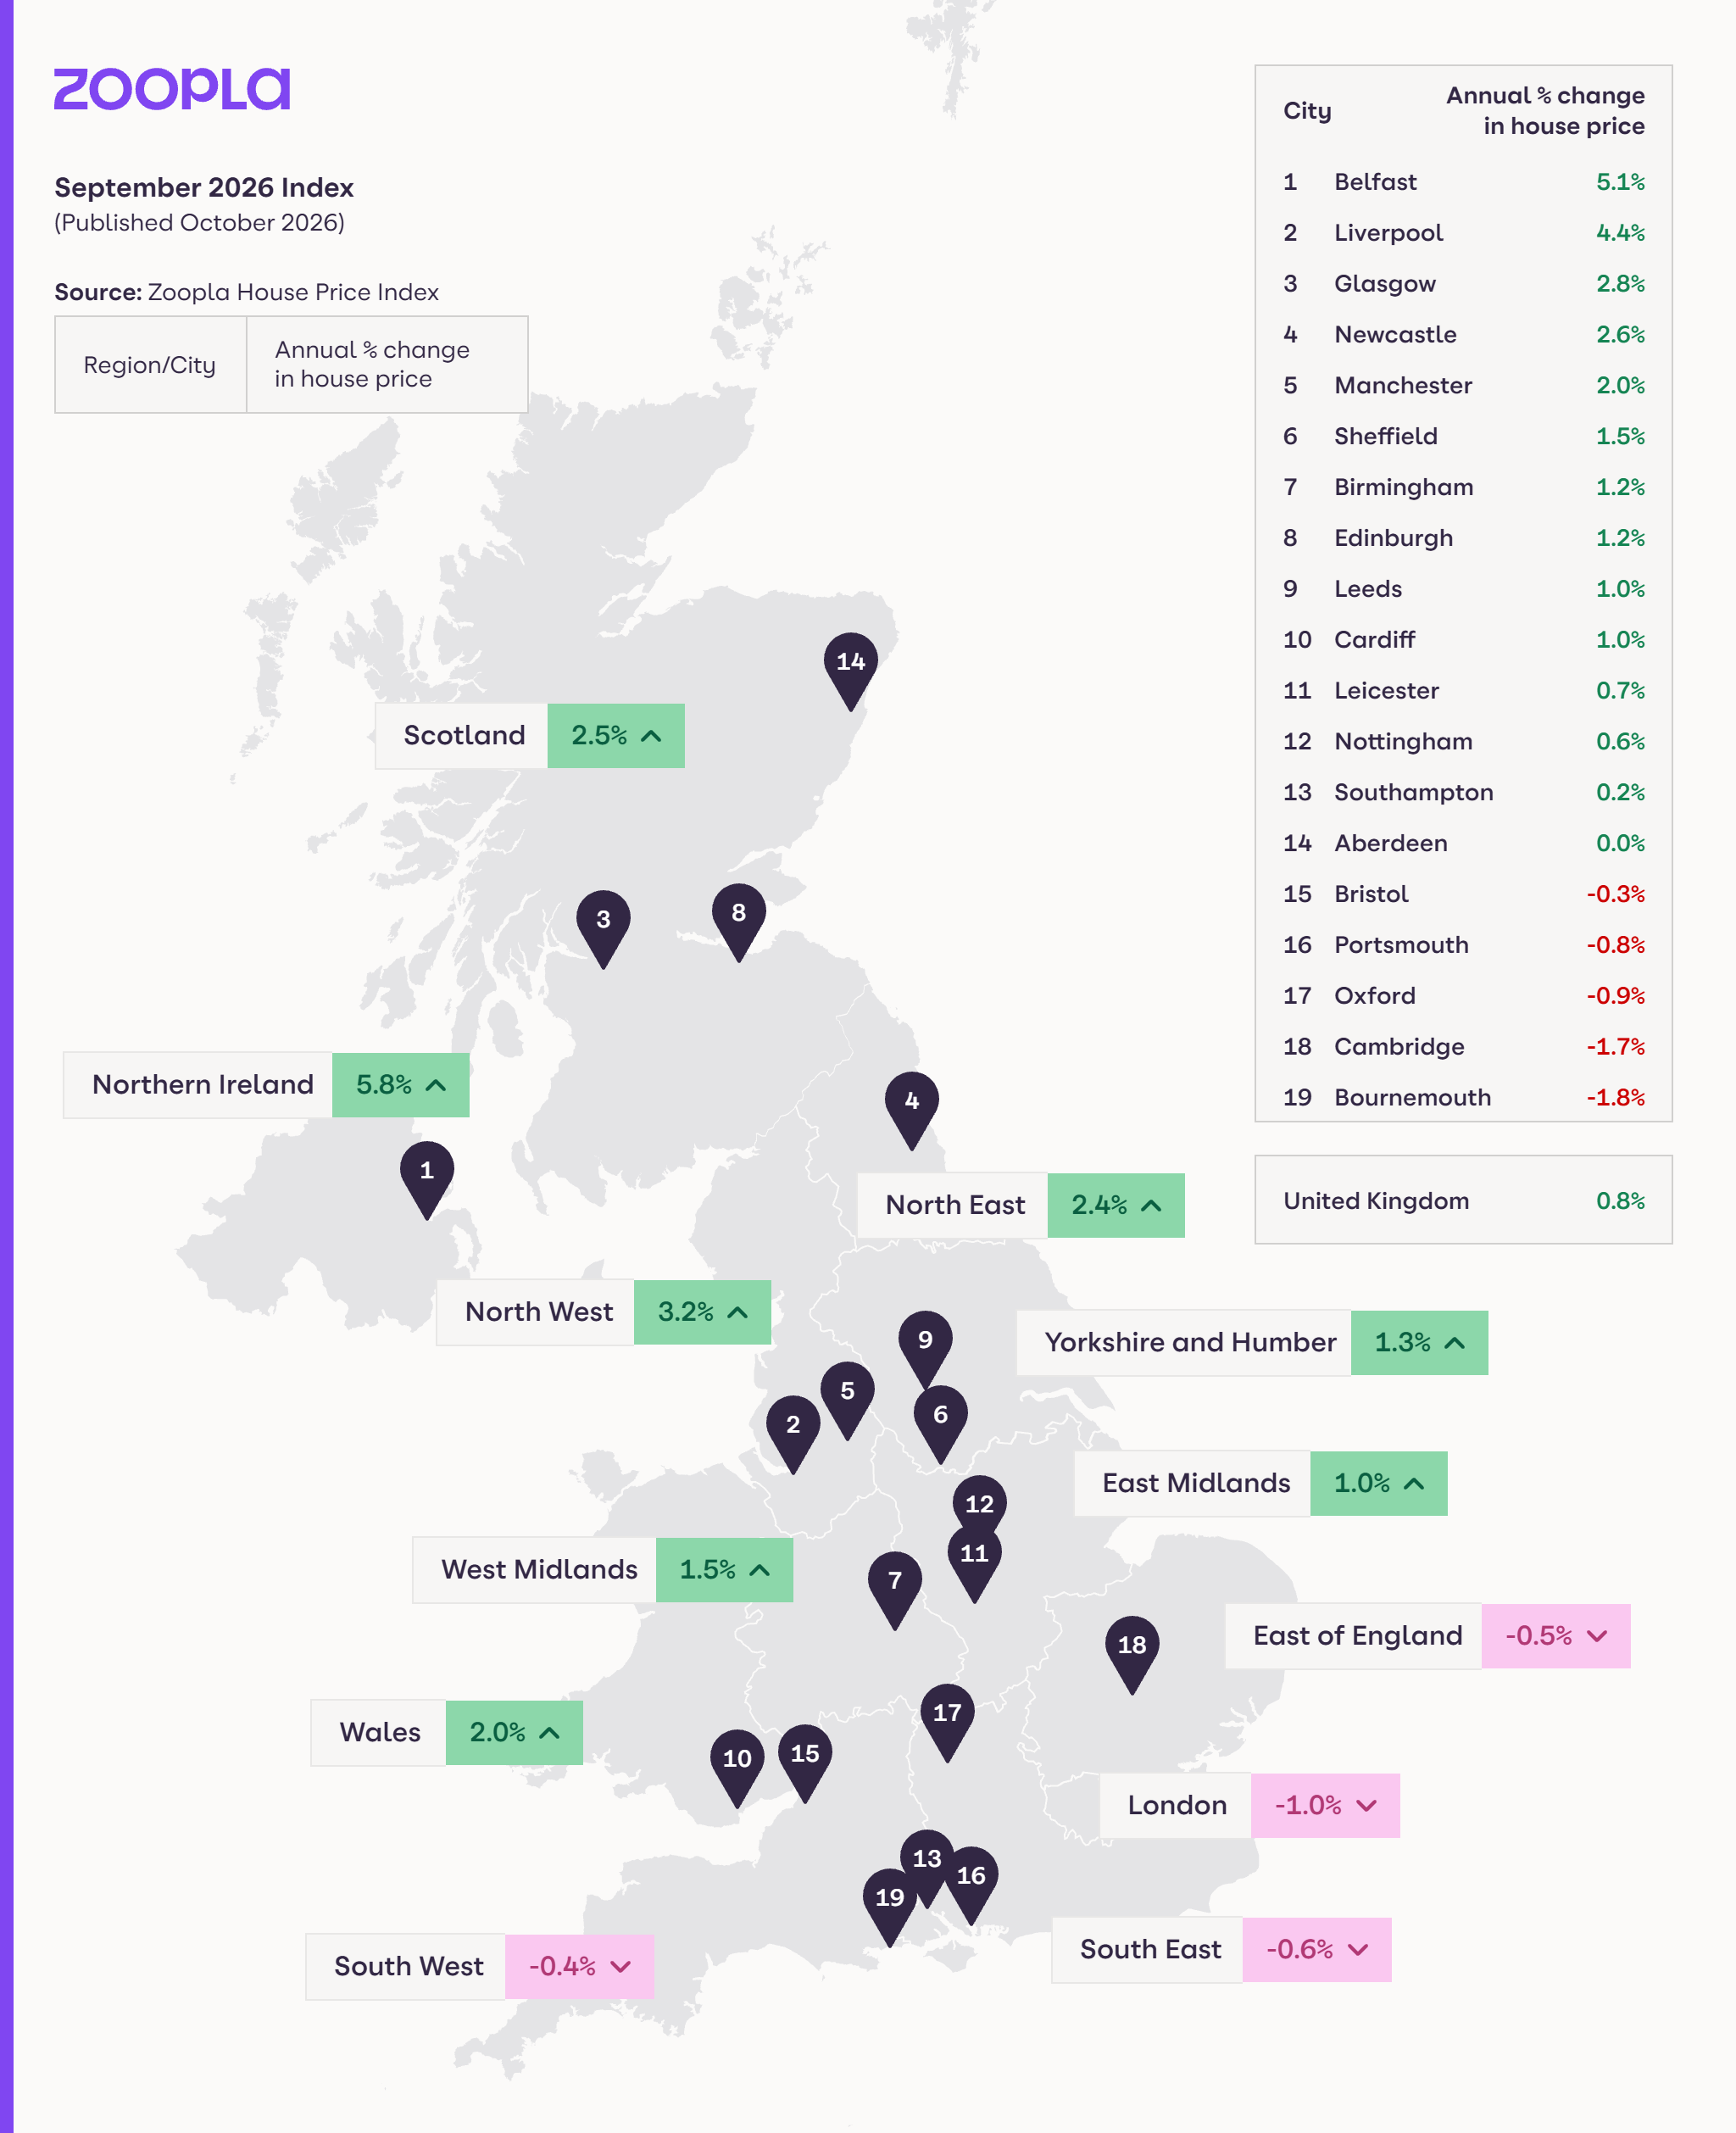
UK house prices rose 0.8% over the last year, but the national average might not reflect what’s going on in your area
Homes that sell find a buyer in 44 days on average, as quickly as last year, with agents needing to underline the importance of setting realistic prices
Join Zoopla for the data, tools and seller audience that help you to win instructions
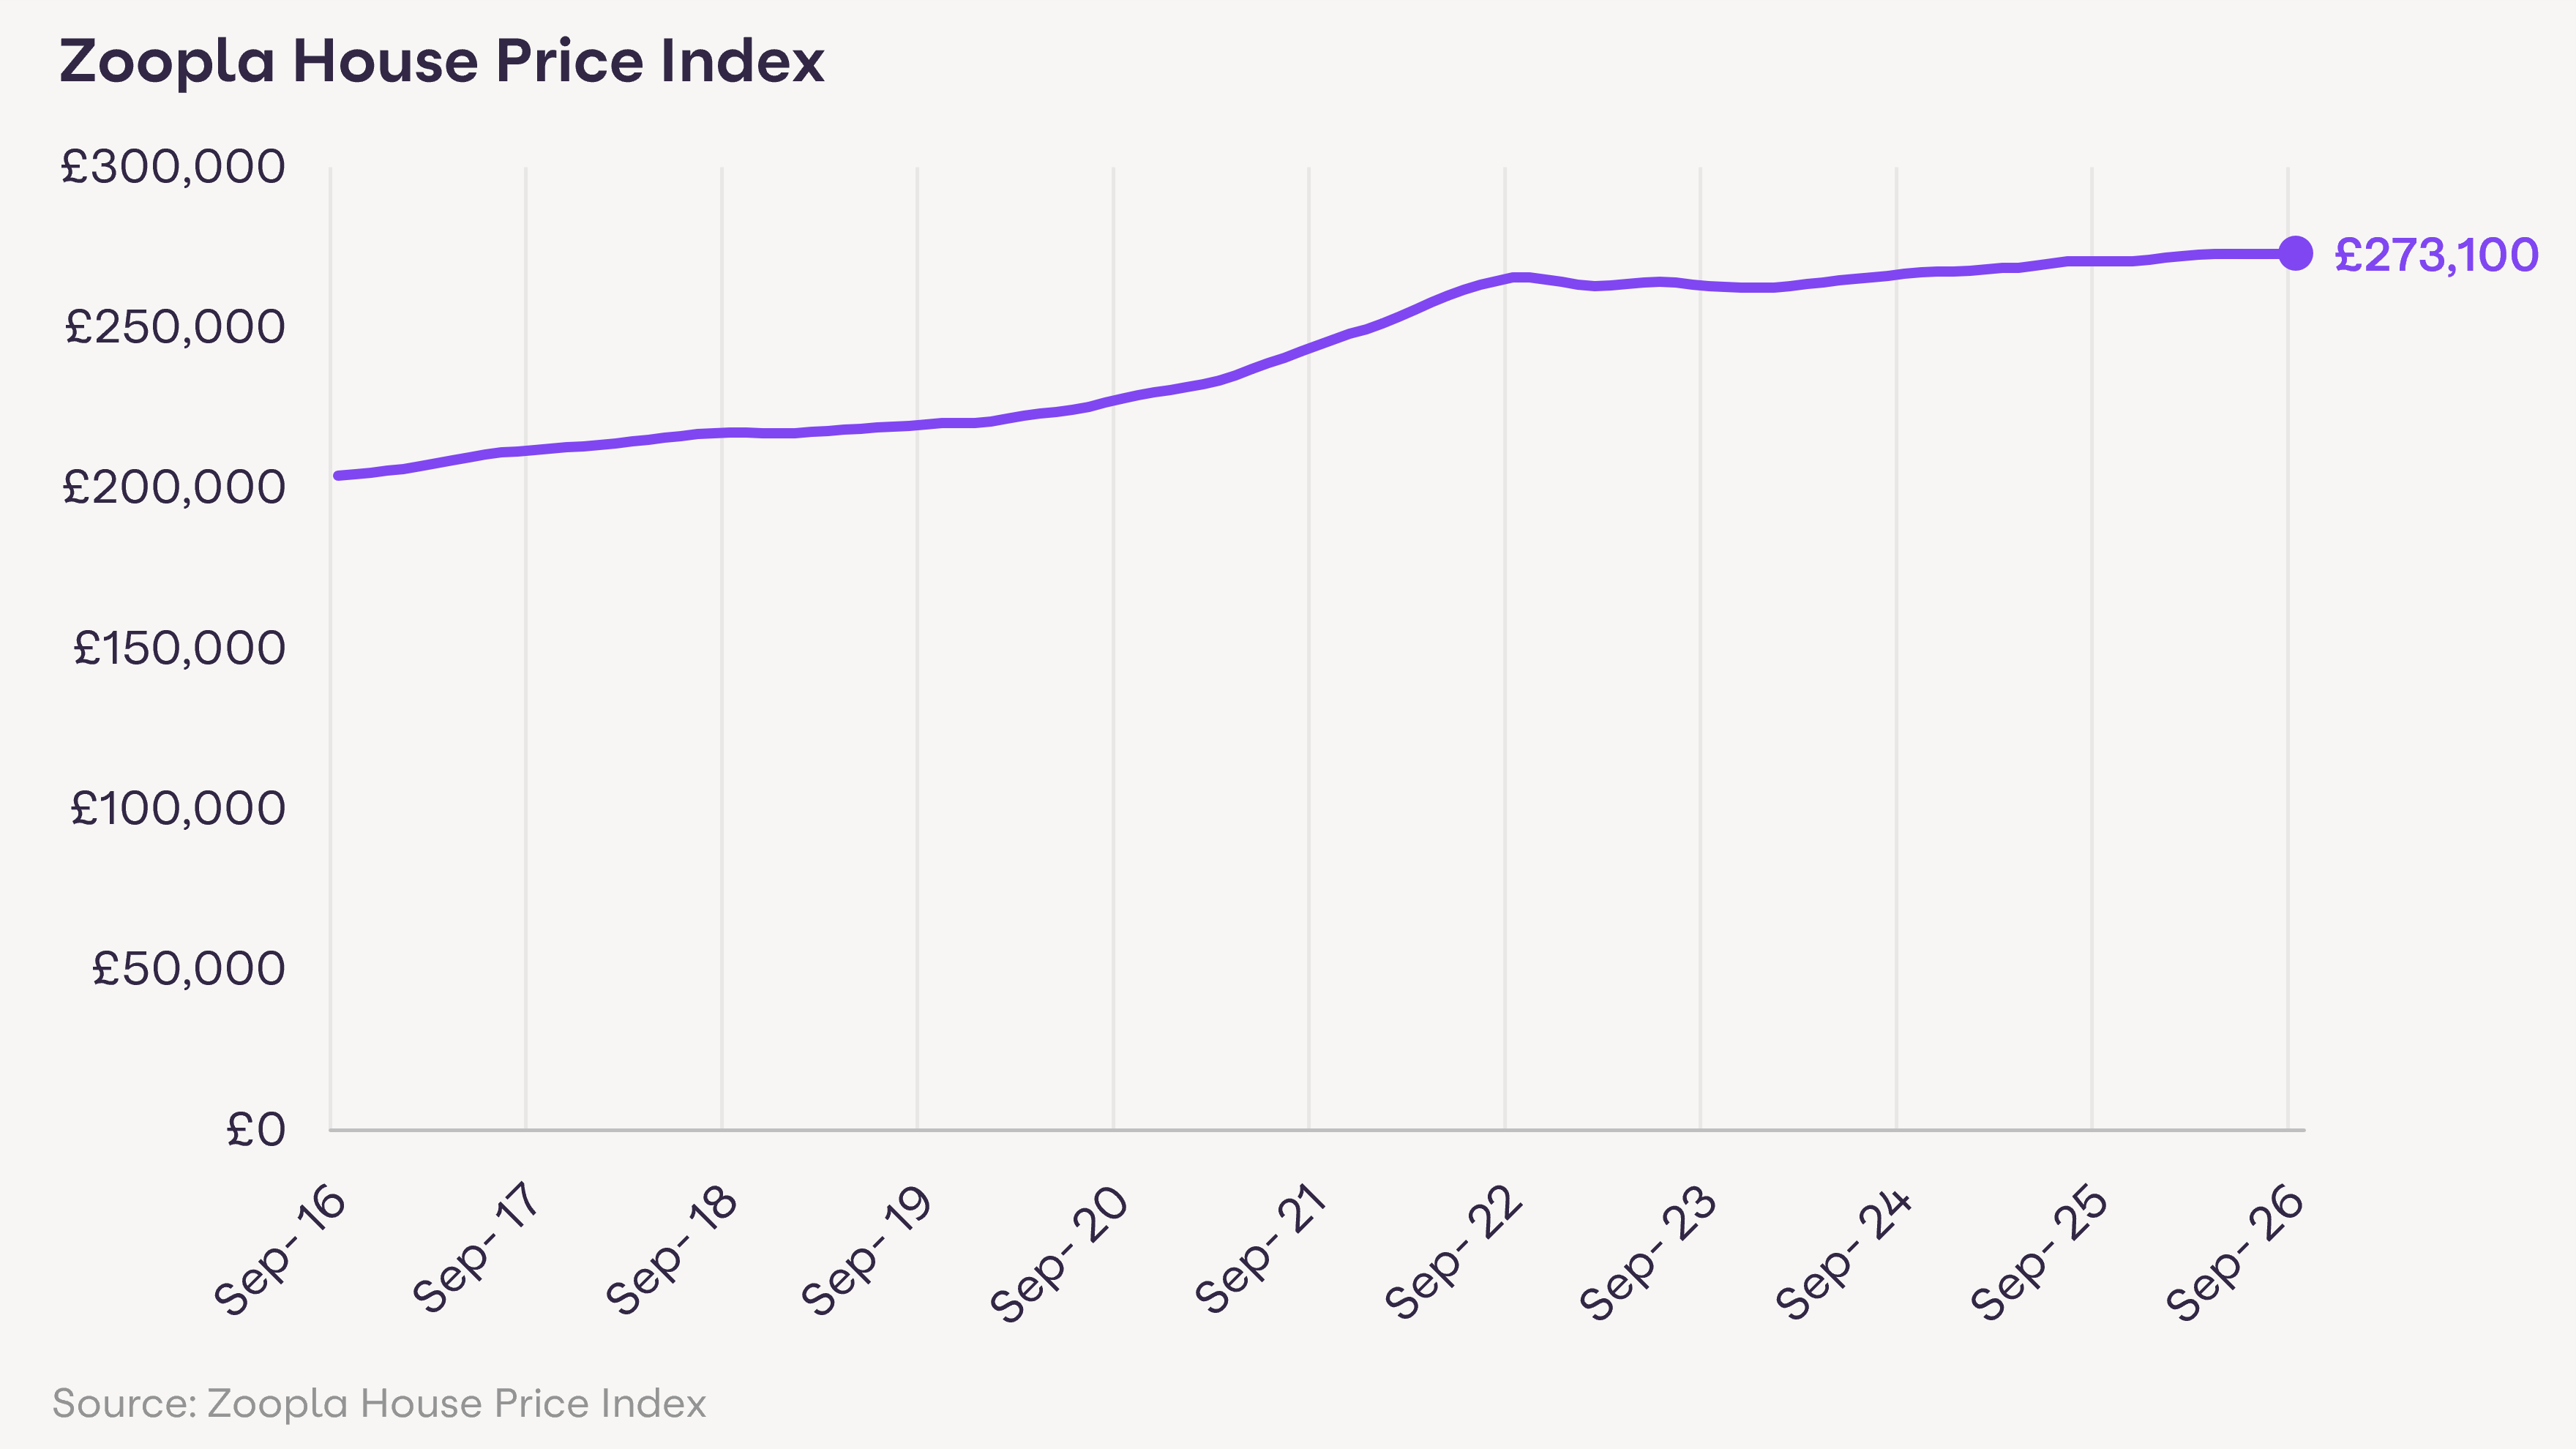
Our latest research shows that UK house prices rose 0.8% in the 12 months to September 2026 with the national average house price now £273,100. Higher mortgage rates have increased the cost of buying a home. Buyer enquiries are weaker than last year, and sales agreed are 7% lower than a year ago.
At the same time, agents have 7% more homes for sale than a year ago, up from 5% in our September report. That means more competition between sellers for buyers, and more pressure on getting the asking prices right from the offset.
Download the Zoopla House Price Index, October 2026 (PDF, 410kB)
Property type | Average house price July 2026 | Average house price August 2026 | Average house price September 2026 | Annual price change to September 2026 (£) | Annual price change to September 2026 (%) |
All property | £273,000 | £273,100 | £273,100 | £2,200 | 0.8% |
Flats/maisonettes | £191,400 | £191,600 | £191,200 | -£4,000 | -2% |
Terraced houses | £282,500 | £282,500 | £282,900 | £4,600 | 1.6% |
Semi-detached houses | £324,400 | £324,400 | £324,600 | £3,900 | 1.3% |
Detached houses | £459,300 | £459,300 | £459,100 | £3,600 | 0.8% |
Source: Zoopla House Price Index, October 2026
Connect with our homeowner audience to win more instructions and grow your market share.

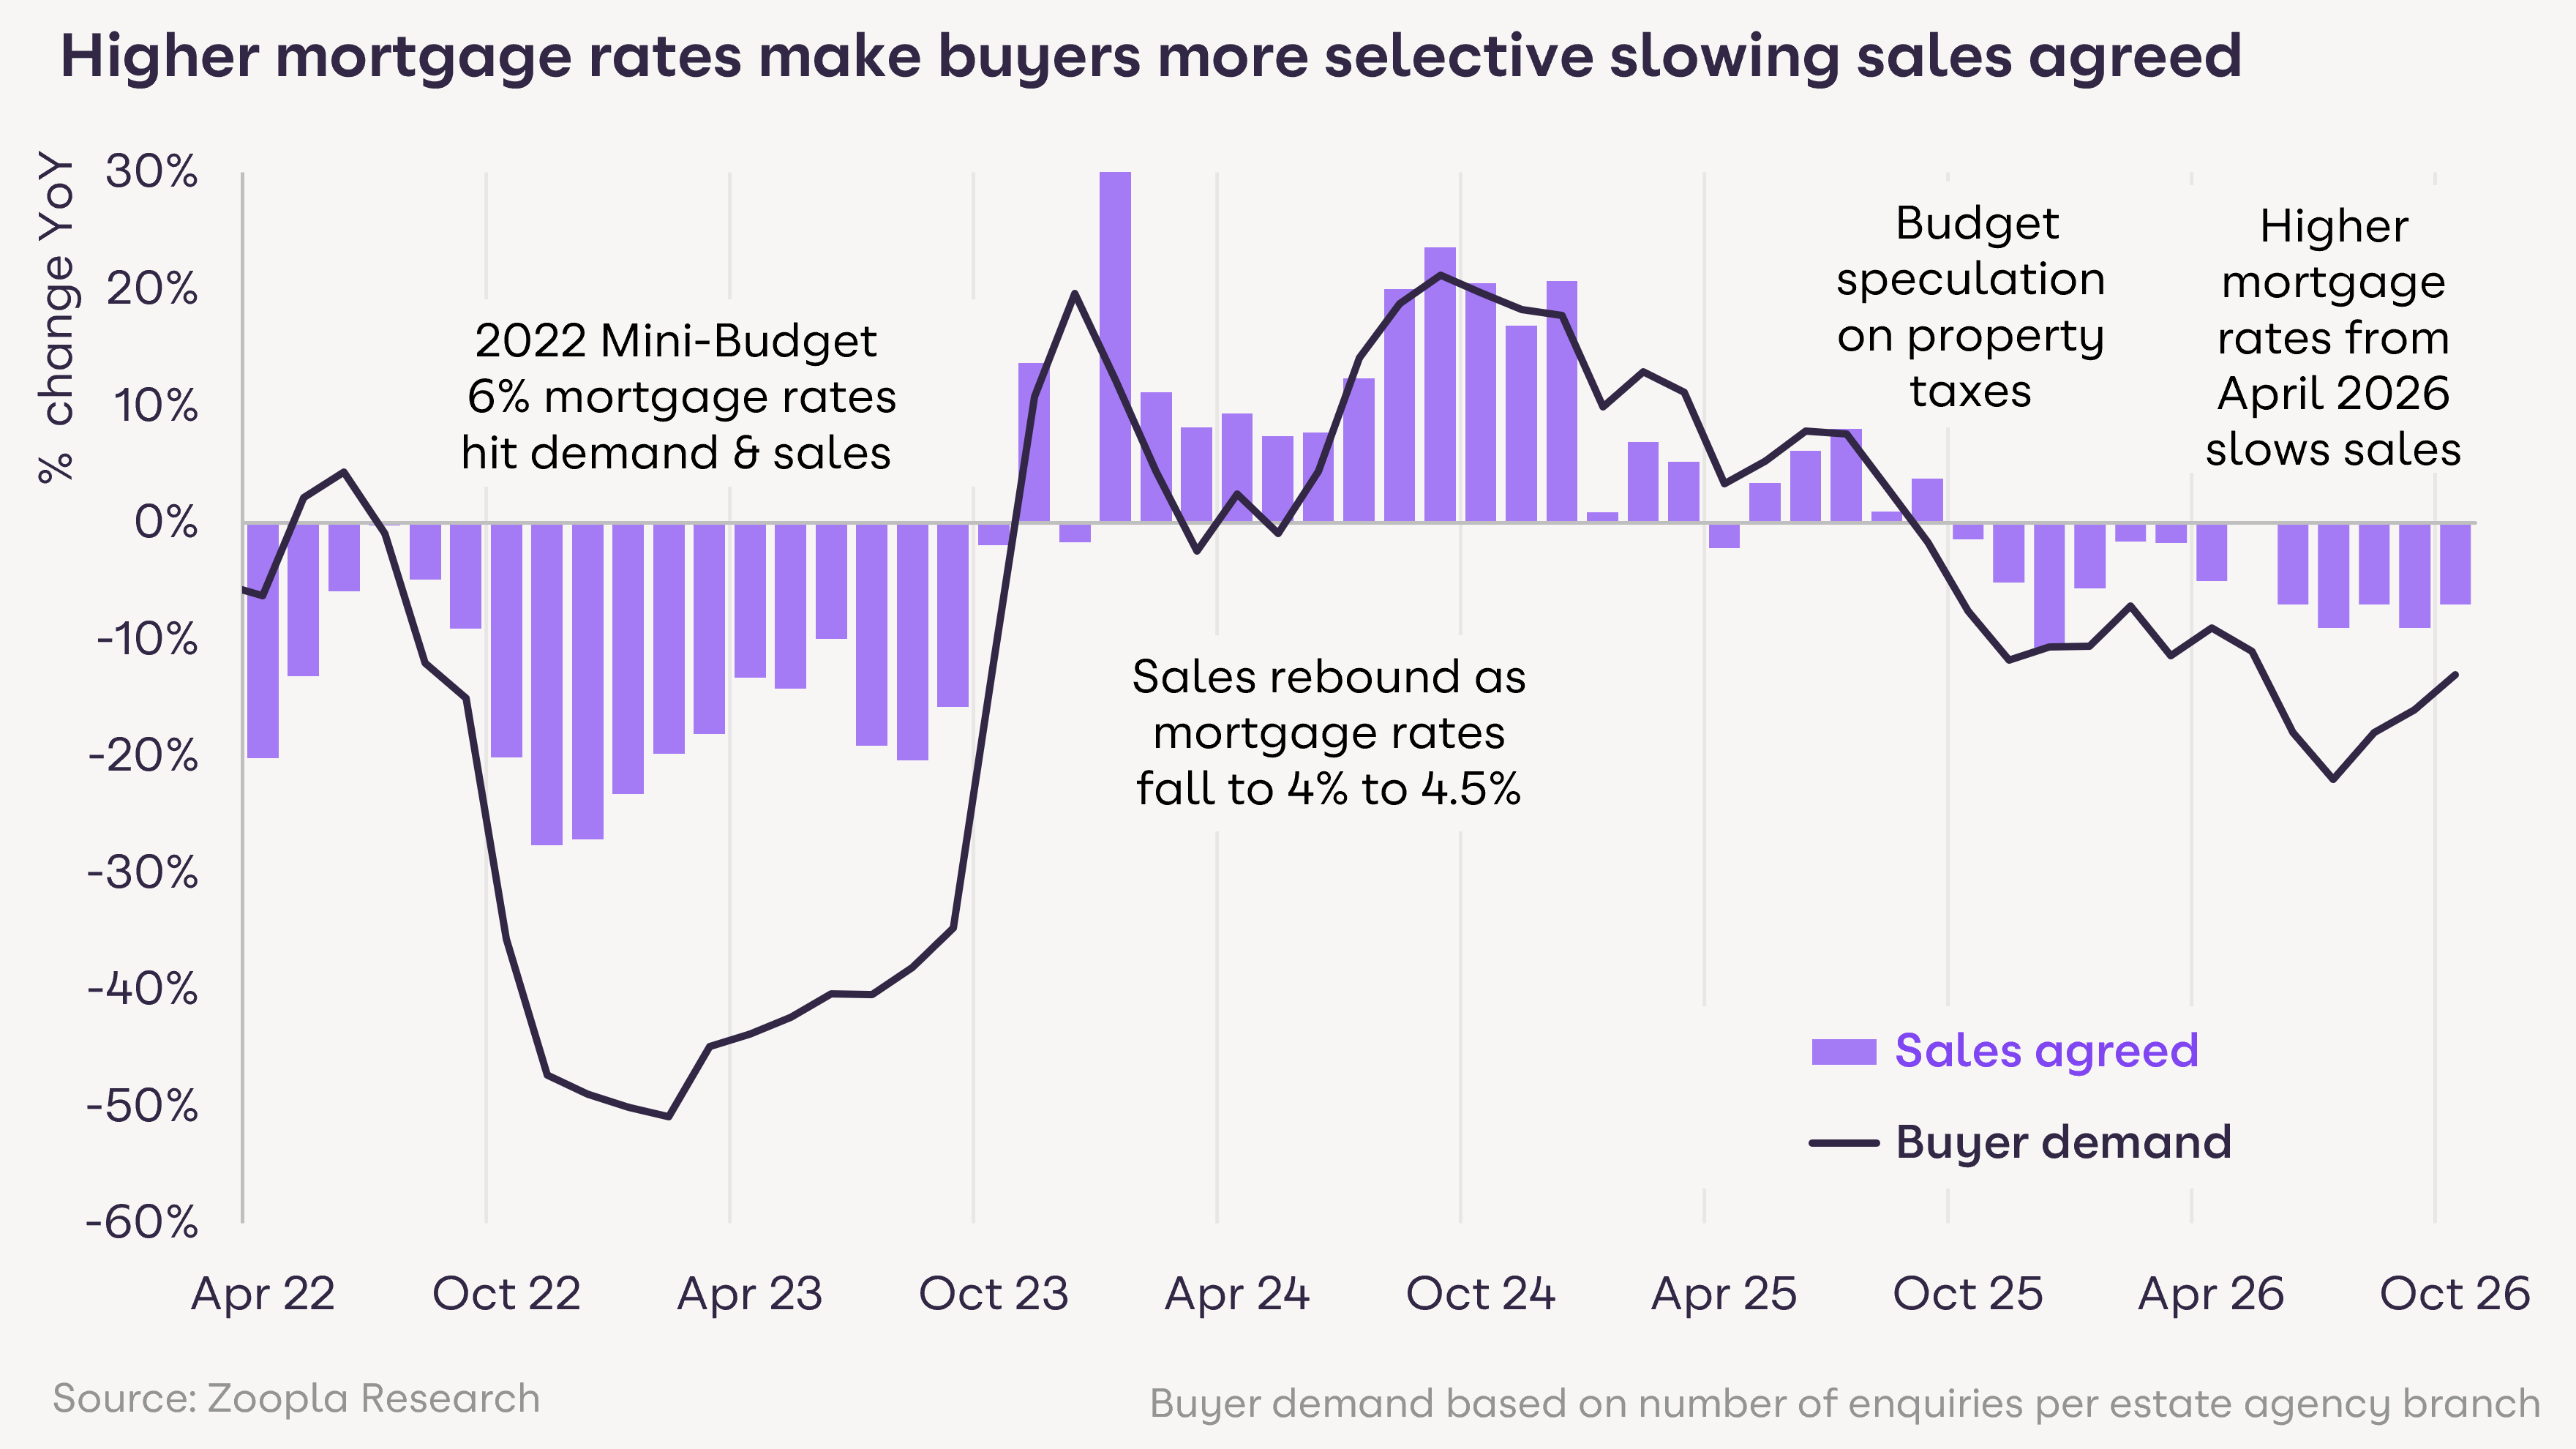
Our data shows that higher borrowing costs since April 2026 have weakened demand. Buyers are more selective about what they view, what they offer on and how much they pay.
The market is still sensitive to mortgage rates. Sales rebounded during 2024 as rates fell to between 4% and 4.5%.
Weaker demand, fewer sales and more stock is the case across most regions. The gap between stock and sales is widest in southern England. In our September report, sales agreed were 9% lower than a year earlier, so the gap has narrowed slightly since then.
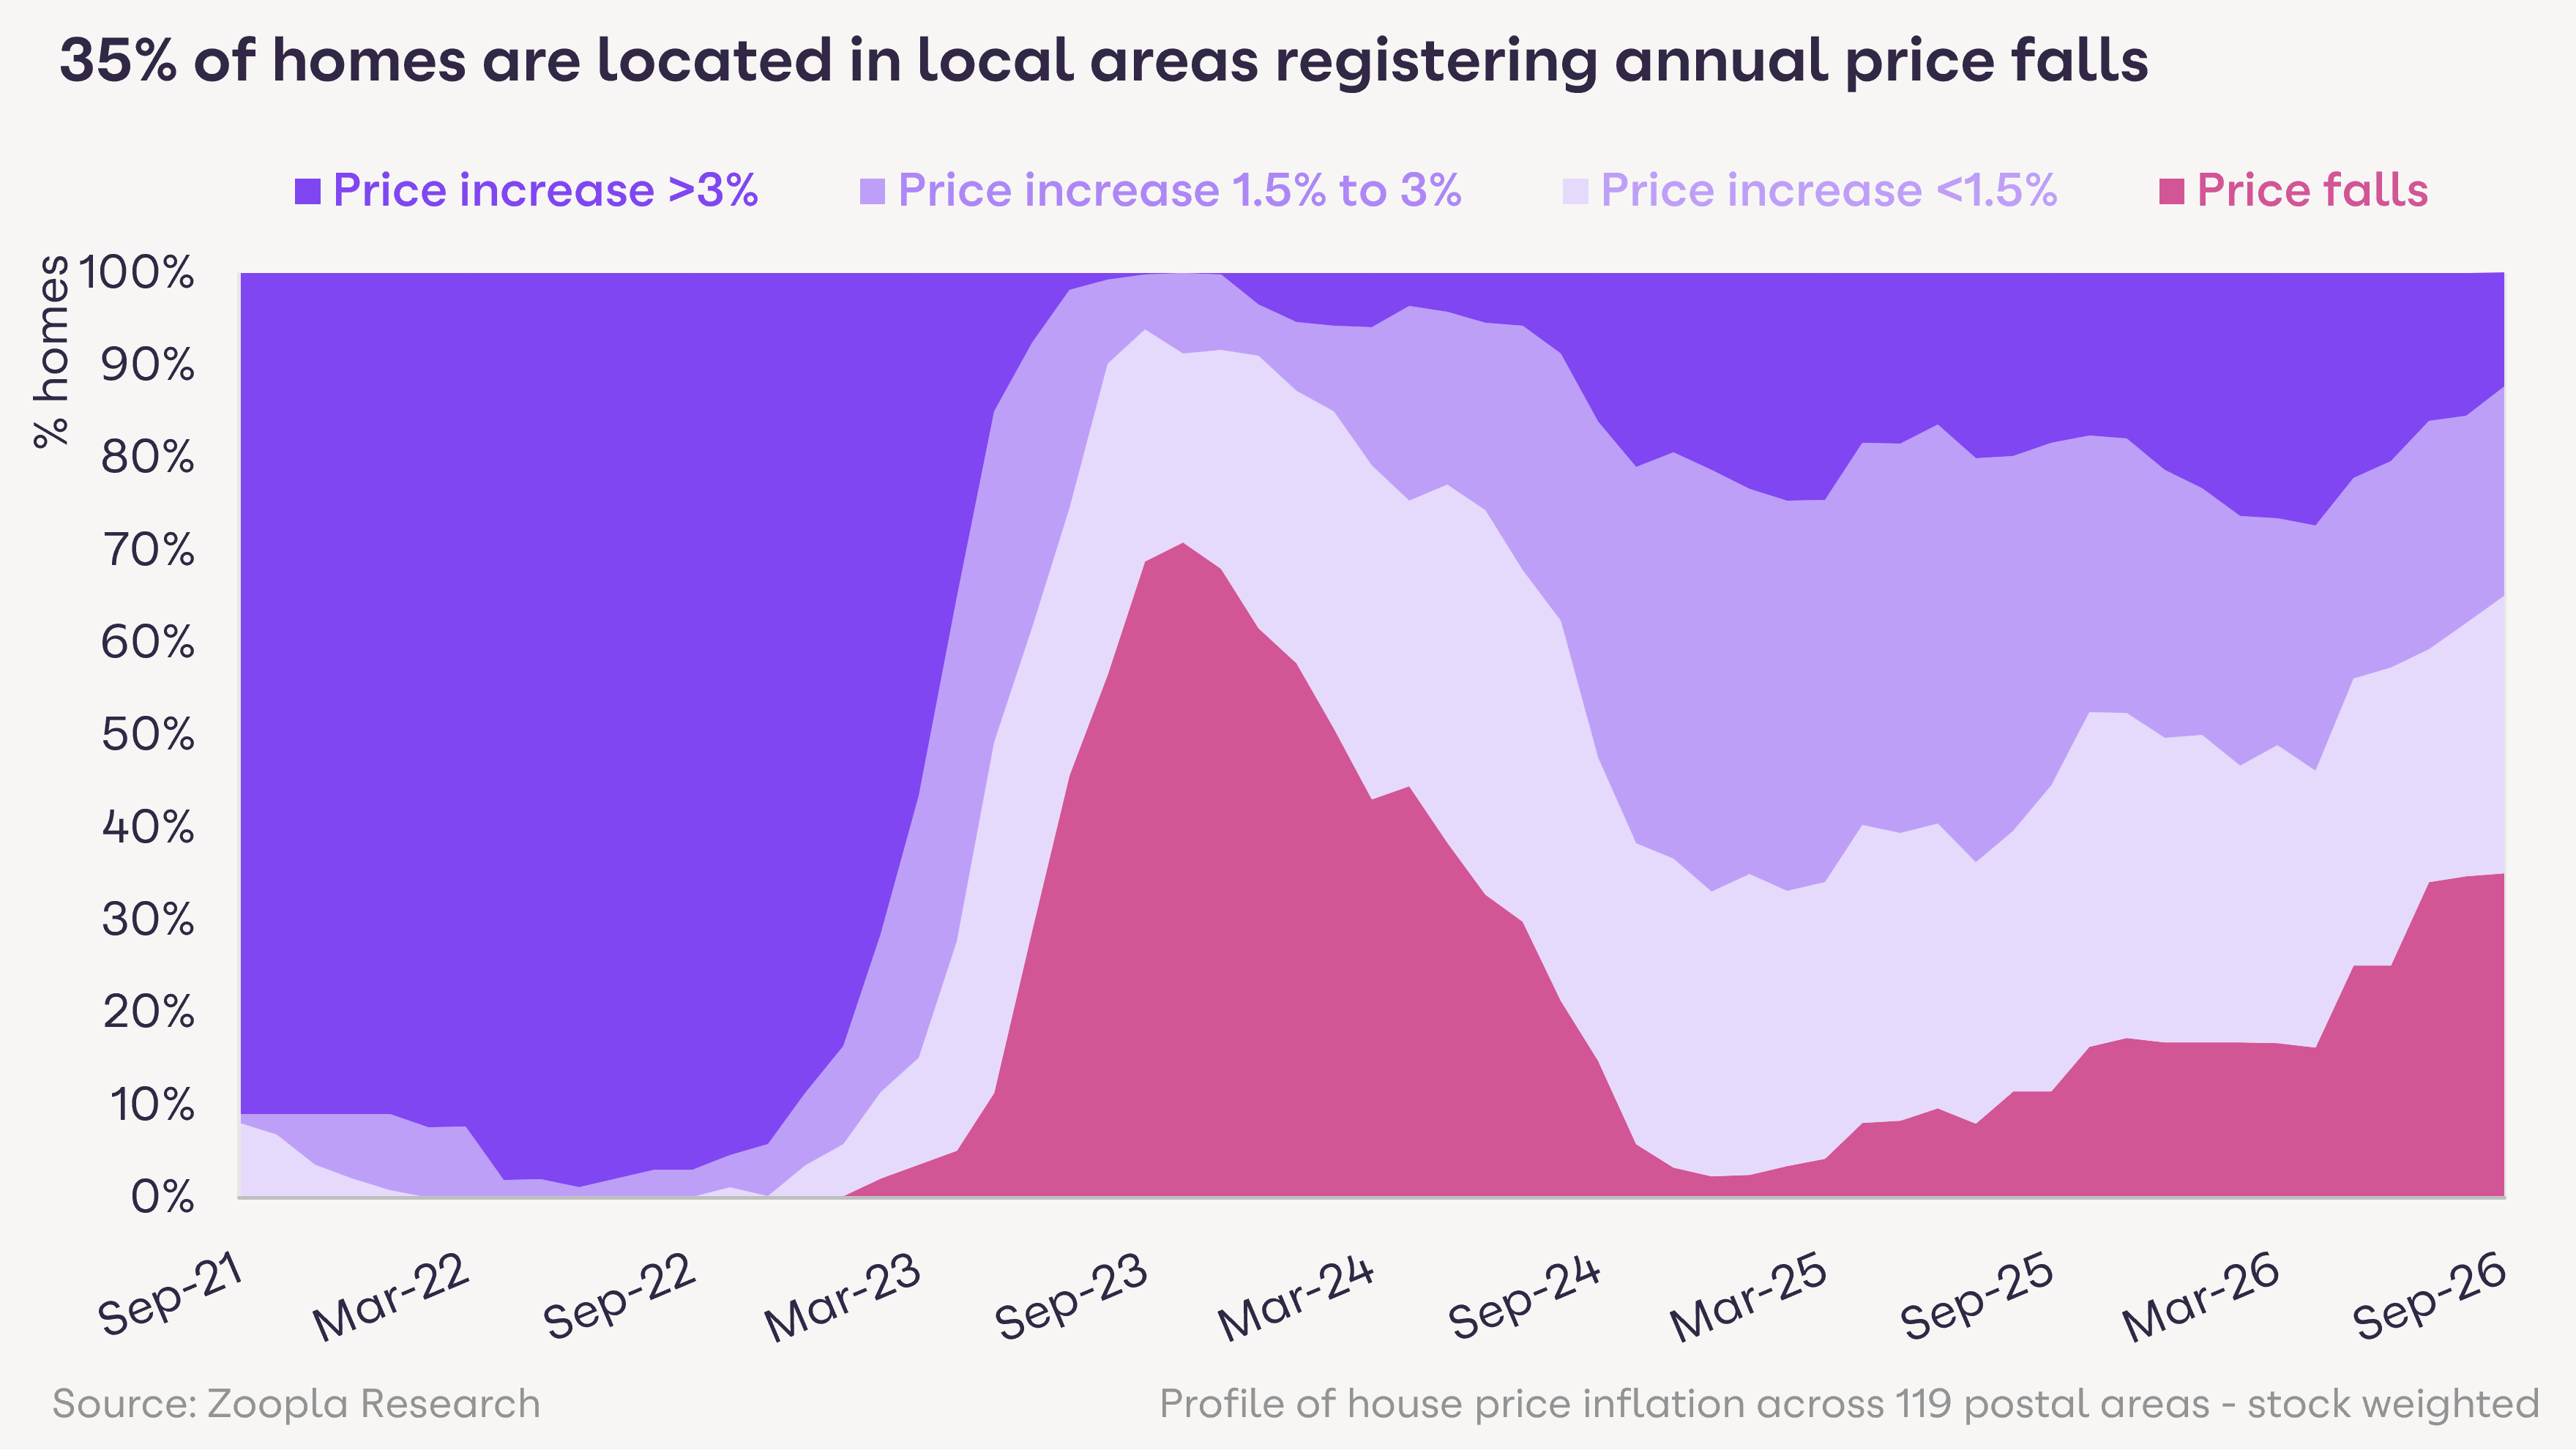
Our data shows that more than a third (35%) of homes are now in postcode areas registering annual price falls, up from 12% a year ago. Homes cost more in southern England, so rising mortgage rates hit buyer budgets hardest there.
In London and the South East, 85% of homes are in postcode areas where prices are falling. Average London prices are 1% lower than a year ago, a fall of £5,400. The South East, the East of England and the South West are also seeing small price falls.
Prices are still rising across most other regions, where homes are more affordable. The North West leads, with average prices up 3.2%, or £6,600, over the year, compared with 3.1% in our September report. Prices are rising by more than 4% in the Liverpool, Carlisle and Kilmarnock postcode areas.
For agents, the local market matters more than the national number. Two neighbouring areas can need very different pricing advice - and agents are best placed to guide sellers during these pricing conversations.
Speak to our team to get started and grow faster in your local market.

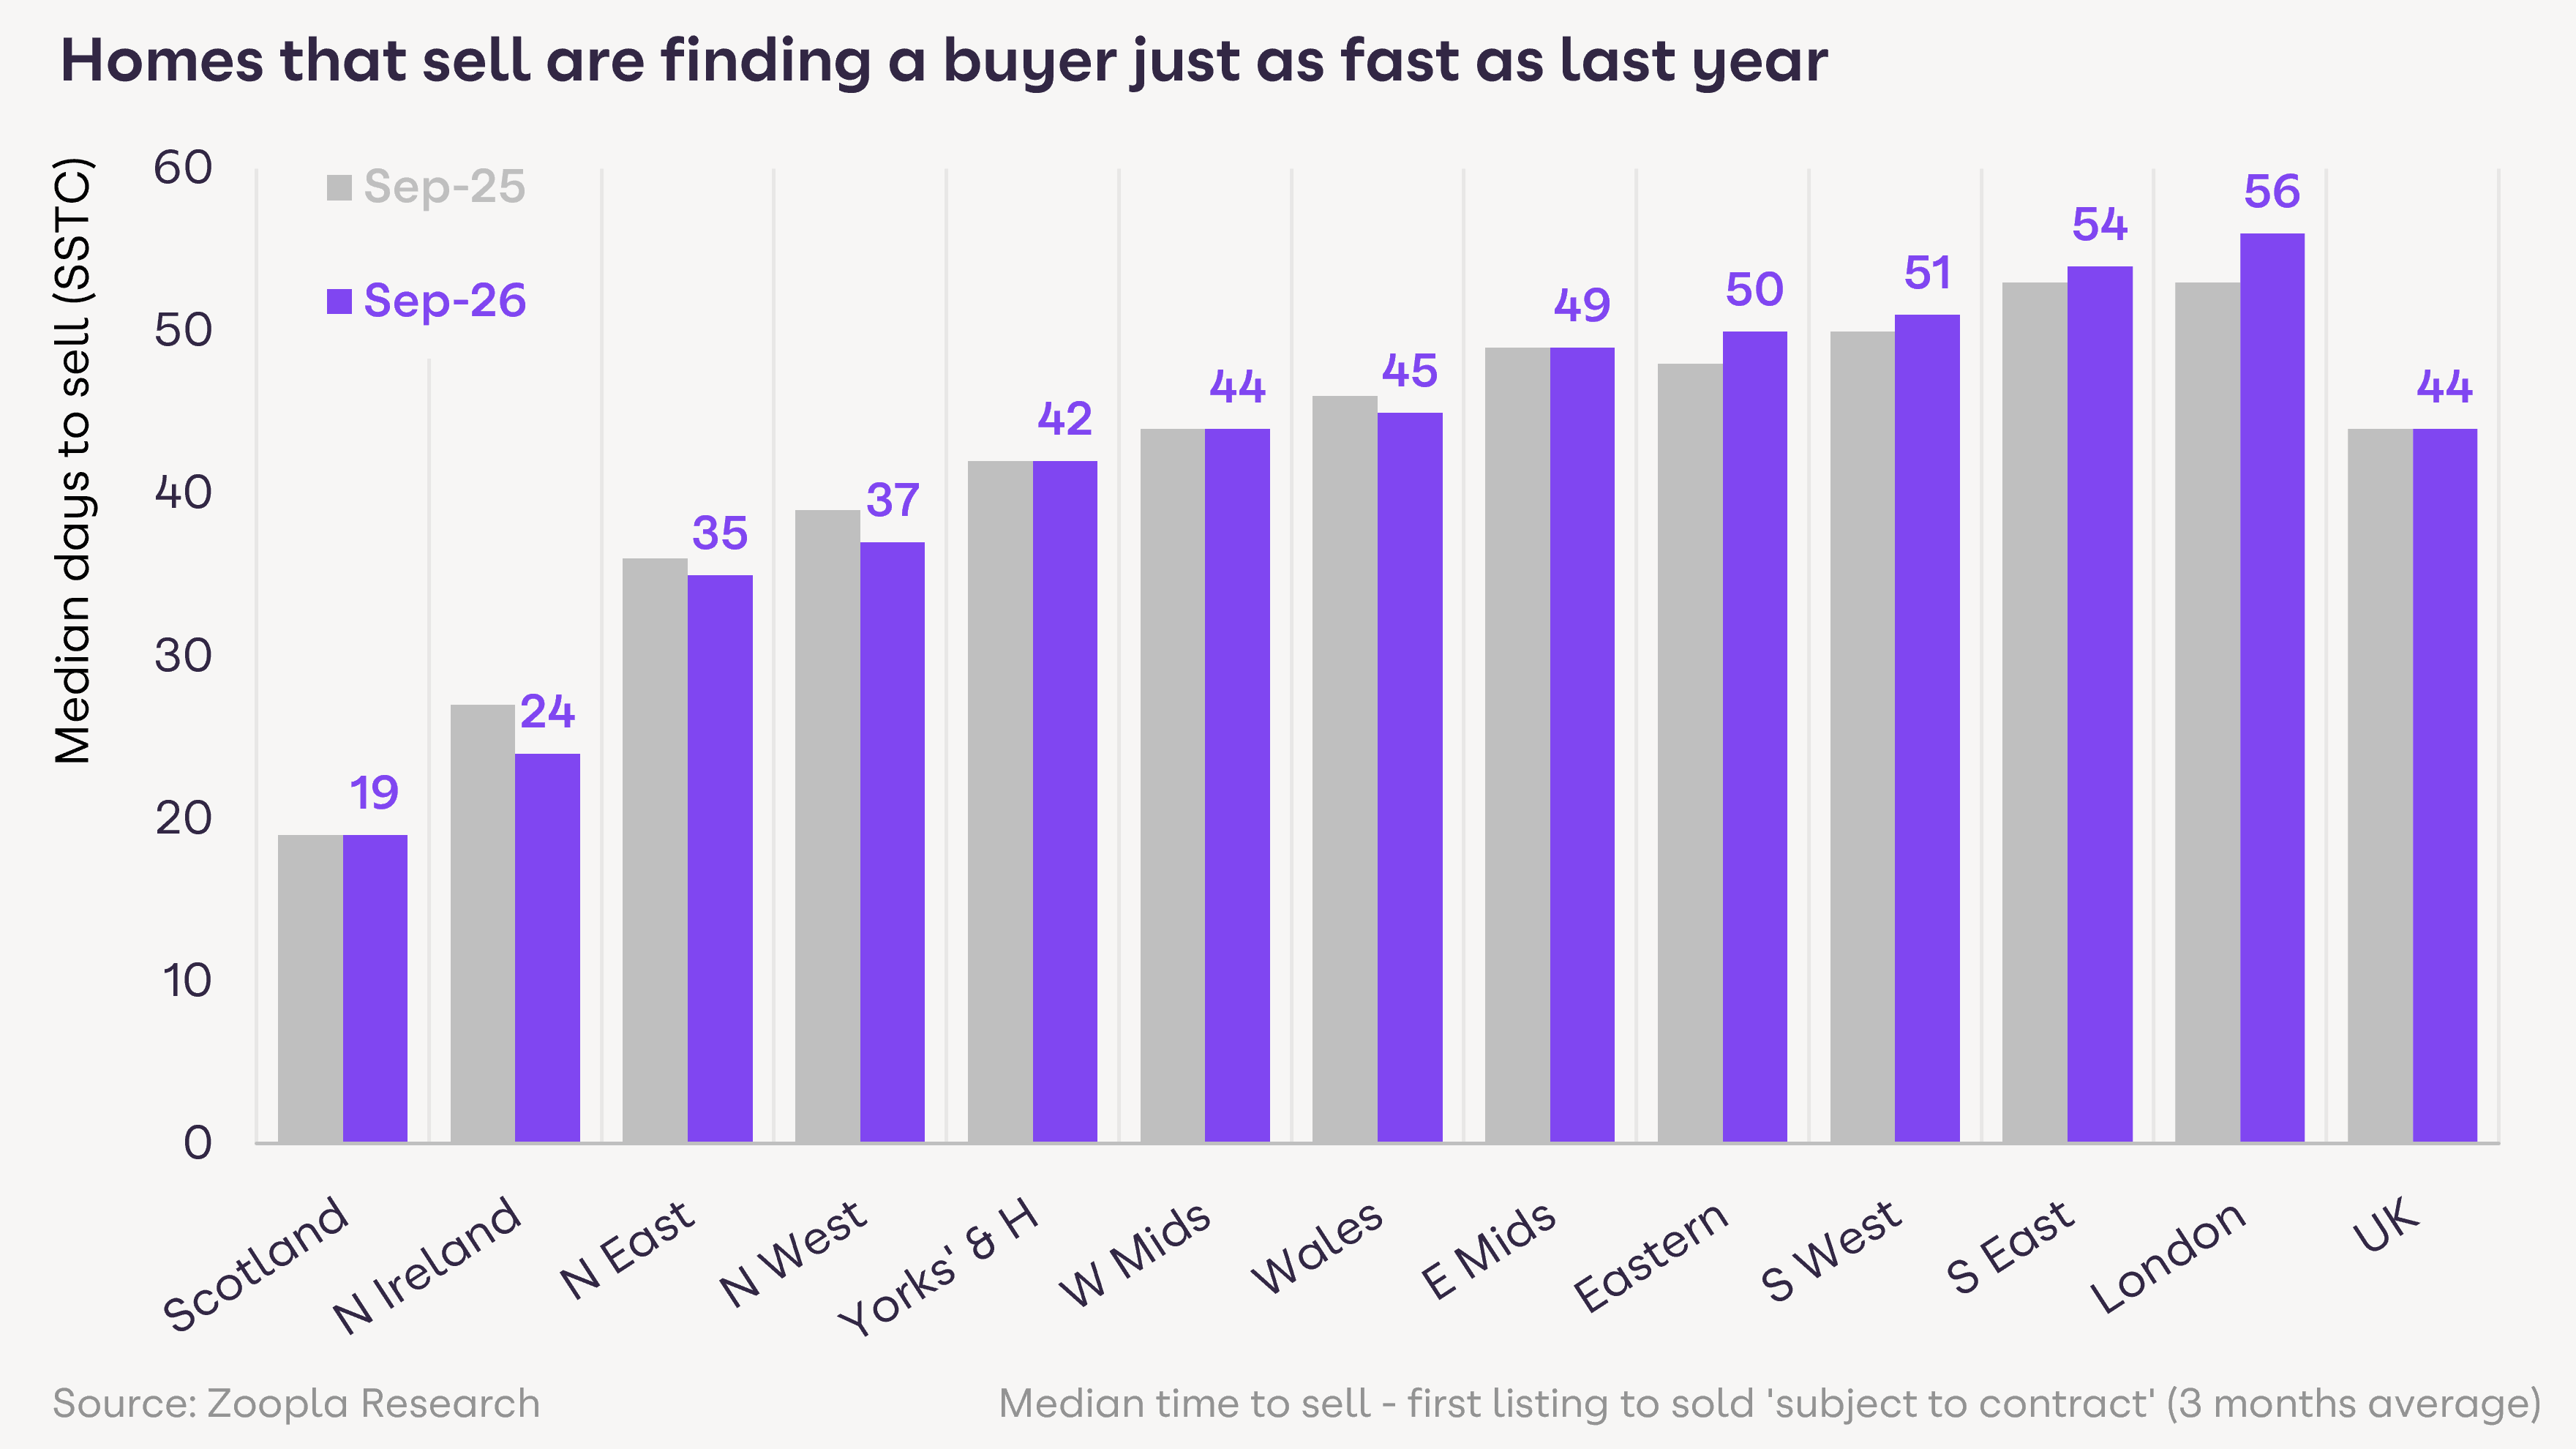
Our data shows that homes that find a buyer are selling as quickly as a year ago, taking 44 days on average. That ranges from 19 days in Scotland to 56 days in London.
This shows buyers are still active. Homes continue to sell when they're priced and presented well.
Pricing is what separates the homes that sell from those that sit on the market. Analysis of homes listed for sale in Q2 2026 found that 41% of homes priced below their estimated value found a buyer within 90 days. For homes priced at least 20% above their estimated value, that figure fell to 26%.
Reducing the price later does not guarantee a sale. Just 19% of homes that had a price reduction sold within 90 days, compared with 41% of those without one. Homes attract the most attention when they first come to market, making the initial asking price critical to securing a buyer.
With 7% more stock and 7% fewer sales agreed, the instructions that convert are the ones priced right from day one.
This month's data points to 1 priority for agents:
Emphasise the importance of pricing realistically from day one: 41% of homes priced below their estimated value found a buyer within 90 days, against 26% of homes priced 20% or more above
Instruction Max is built for agents who want to be the go-to valuation agent in their area. It includes Prospect Plus, Valuation Booster, Featured Agent and the Zoopla Valuation Tool. Our data shows that 43% of Prospect Plus valuation leads on average convert into a listing on Zoopla.
Explore Instruction Max and our other packages to find the right fit for your branch.
The outlook for 2027 depends on mortgage rates, household confidence and the wider economy, according to our latest analysis.
In our view, the Budget's most important influence would be to support the conditions for lower mortgage rates over 2027. A Budget that reassures financial markets and helps contain inflation could reduce borrowing costs and support housing market activity.
Widespread property tax reform looks unlikely in the near term. Targeted stamp duty changes could reduce upfront costs for buyers.
The proposed Your First Home equity loan scheme would help more first-time buyers buy new homes with low deposits. With the income and price caps set at the right levels, it would boost housebuilders and could lift demand across the wider market.
Valuations need to reflect current buyer demand and competing stock, not historic sale prices. Our data shows that more than a third (35%) of homes are now in postcode areas with annual price falls, rising to 85% in London and the South East.
Our data shows that higher mortgage rates have made buyers more selective, and sales agreed are 7% lower than a year ago. Agents also have 7% more homes for sale, so buyers have more choice.
Our data shows that homes that find a buyer take 44 days on average, as quickly as last year. That ranges from 19 days in Scotland to 56 days in London.
A price reduction is no guarantee of a sale. Our data shows that only 19% of homes with a price reduction sold within 90 days, compared with 41% of homes without one.
The Budget's biggest effect is likely to come through mortgage rates in 2027. A Budget that helps contain inflation could support lower borrowing costs. The details of the proposed Your First Home scheme will matter for demand for new homes.
The Zoopla House Price Index (HPI) tracks the change in achieved sales price of homes (not asking prices). The index uses sold prices, mortgage valuations and data for recently agreed sales with more input data than any other index. The methodology is designed to accurately track the change in pricing for UK housing. It's revisionary and non-seasonally adjusted.
Download the Zoopla House Price Index, October 2026 (PDF, 410kB)
Notes on this month's data:
Market activity data covers the four weeks to 18 October 2026, compared with the same period in 2025
Mortgage rate comparisons are based on the average rate for a new 75% loan-to-value, five-year fixed mortgage
Our House Price Index tracks prices across 119 postal areas. In September 2026, 37 of them recorded annual price falls, and these areas hold 35% of homes
Time to sell is the number of days between a home first going on the market and being sold subject to contract
The asking-price analysis covers homes put up for sale in Q2 2026
Source: Zoopla House Price Index, October 2026
We try to make sure that the information here is accurate at the time of publishing. But the property market moves fast and some information may now be out of date. Zoopla accepts no responsibility or liability for any decisions you make based on the information provided.
We try to make sure that the information here is accurate at the time of publishing. But the property market moves fast and some information may now be out of date. Zoopla accepts no responsibility or liability for any decisions you make based on the information provided.
Get an edge with exclusive lessons from industry expert Ian Preston.
Read more
With unrealistic pricing by sellers the key reason homes are unlikely to sell, our latest research explores how agents might help reset their expectations and win instructions rooted in achievable pricing.
Read more
Rental growth is picking up as supply starts to fall. Our latest report looks at what this means for landlords and letting agents, and where the opportunities are in the rental market.
Read more